From the community: visualize your content model
blogDetail.published August 8, 2017


blogDetail.subscribeCard.title
blogDetail.subscribeCard.description
Proper content modeling usually results in a lot of small building blocks of reusable content. Let's take contentful.com as an example –
it consists of around 20 different content types that are connected to each other in some way. Even though this helps us to stay flexible, it can sometimes be hard to see the bigger picture.
Can a page entry have only one or multiple authors?
How many assets are linked to an article?
What are the given field names of a particular entry?
Especially when consuming the API, these kinds of questions come up constantly and I find myself entering the web app regularly to check the details of a content model. Doing so is perhaps not the worst thing in the world, but it would be good if it was easier to get a complete overview.
Meet contentful-graph
contentful-graph is an npm package developed by Yaraslau Kurmyza which aims to help with the visualization of content models.
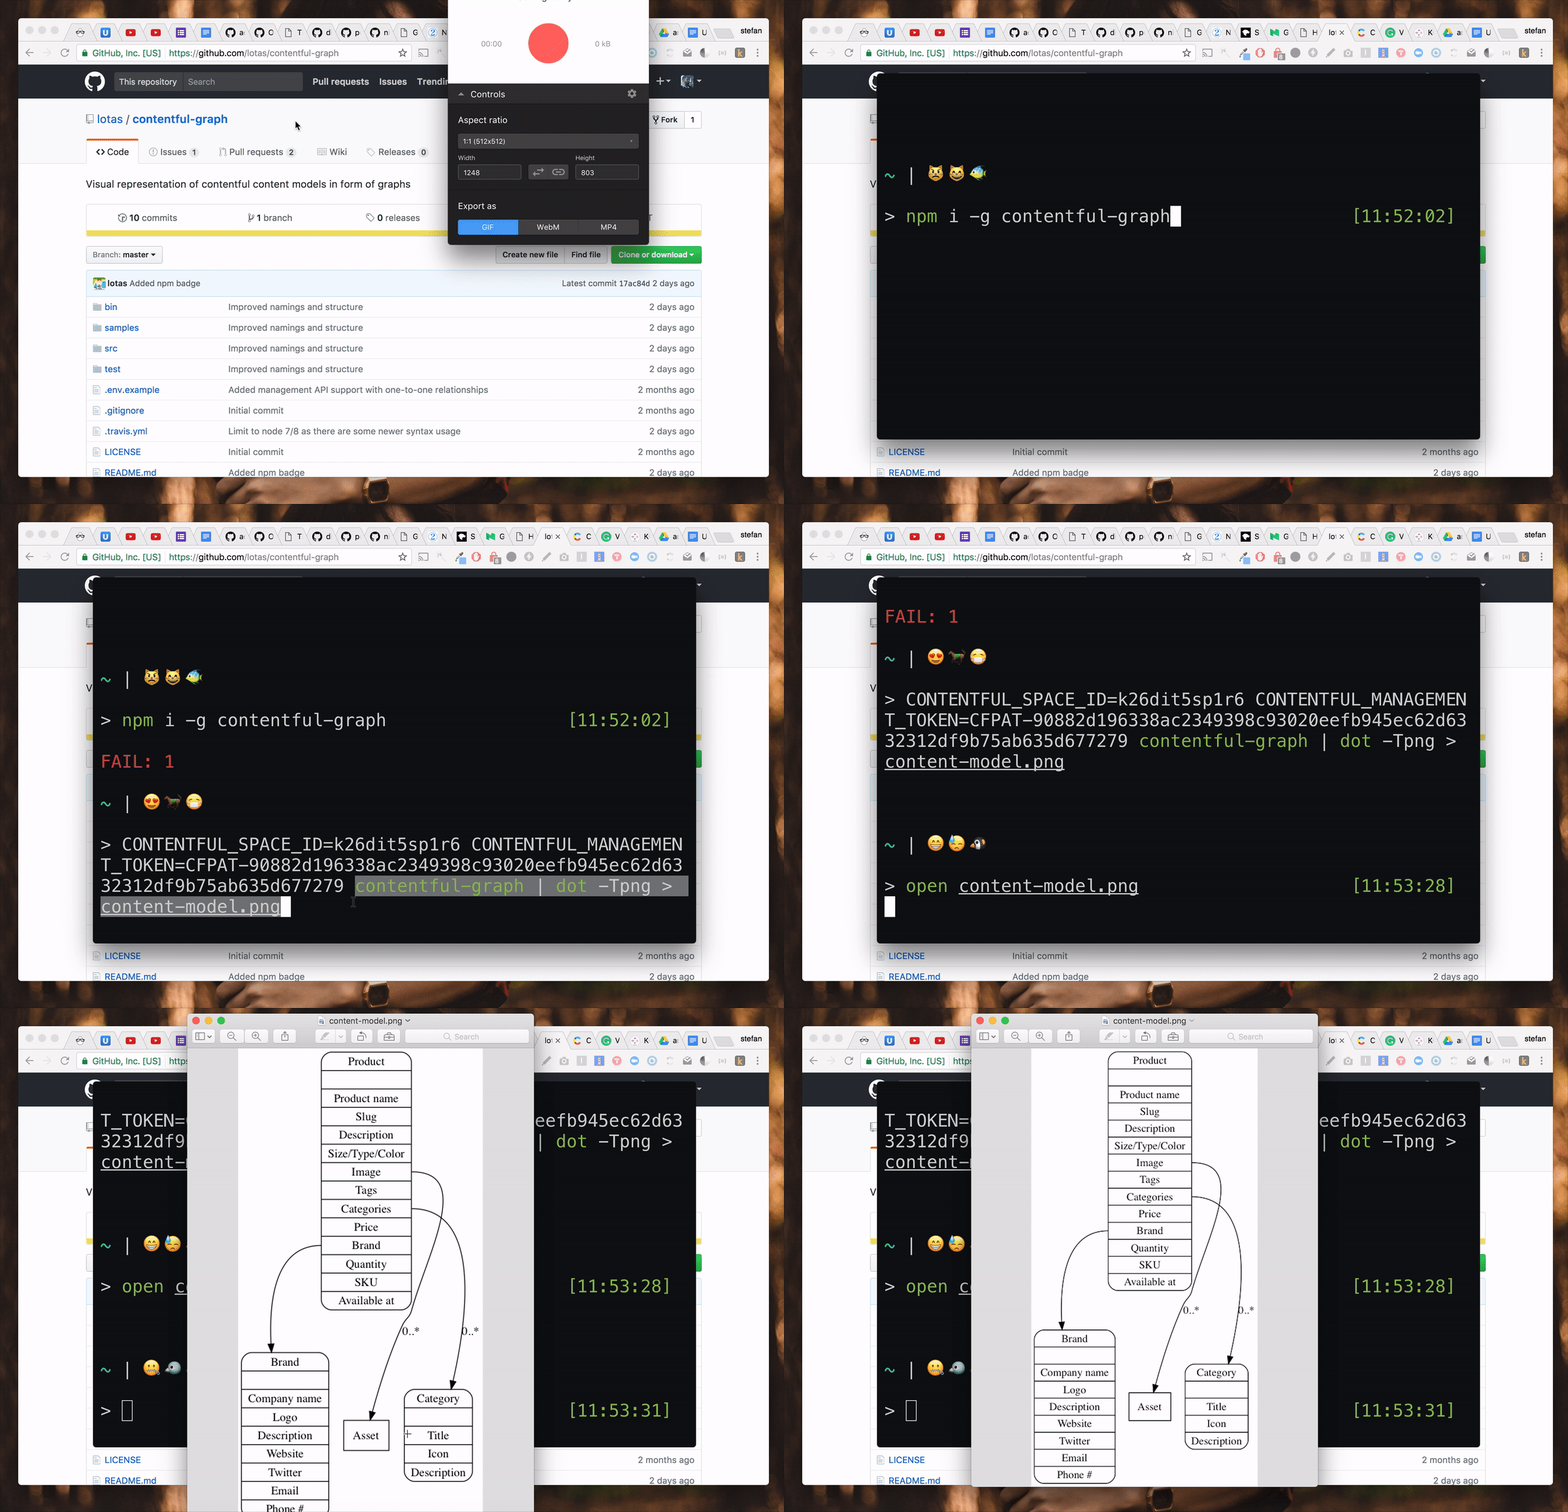
The contentful-graph works by analyzing a content model and displaying its relations using DOT.
This looks relatively unspectacular, but graphs described in this format can easily be visualized using the dot command which is included in the Graphviz library.
To visualize the graph all you have to do is to pipe it into the dot command, define a file format and write it to disk. Magic!
The rendered image is indeed handy! For me, this means that I'll print out all the content models and put them on a wall next to me so that I don’t have to enter the web application.
contentful-graph is a young project but I think it has big potential to become my daily companion. Big thanks to Yaraslau for putting this together
If you built something yourself, let us know!
We would love to see and share more tools coming from the community. So don't hesitate to reach out via our Slack community channel at contentful.com/slack or via email to devrel@contentful.com and tell us what part of your ecosystem you have written yourself.
You should also check out contentful-graph-web, a simple web app utilizing the contentful-graph library to display graphs of contentful models.
And last but not least: head over to our Contentful Community forum and experience friendly peer-to-peer support at its best.

blogDetail.subscribeCard.title
blogDetail.subscribeCard.description
blogDetail.authors

Stefan Judis
Senior Manager, Developer Relations
Stefan was formerly a Senior Manager, Developer Relations at Contentful. He loves web performance, new technologies, and accessibility.
blogDetail.relatedArticles

Use content taxonomy to increase conversions
November 24, 2025

How to serialize and deserialize JSON for C#, JavaScript, and Python with examples
July 22, 2026

Best VS Code extensions for developer productivity
July 10, 2025

Ready to start building?
Put everything you learned into action. Create and publish your content with Contentful — no credit card required.