Experience Insights
Übersicht
Mit Experience Insights können Sie Ihre Erlebnis-Performance analysieren, um zu verstehen, wie Experimente und Personalisierungen Ihren Zielen dienen.
Durch die Verfolgung der Leistung von Personalisierungen und Experimenten erhalten Marketer und Datenanalysten umsetzbare Erkenntnisse, die eine datengestützte Entscheidungsfindung ermöglichen. Es bietet statistische Analysen, ohne eine weitere Informationsquelle zu schaffen, die direkt in Ihren aktuellen Datenworkflow integriert wird.
HINWEIS: Um Experience Insights zu verwenden, müssen Sie es zunächst einrichten. Weitere Informationen zum Einrichten von Experience Insights finden Sie im Abschnitt Einrichten von Insights in der Entwicklerdokumentation.

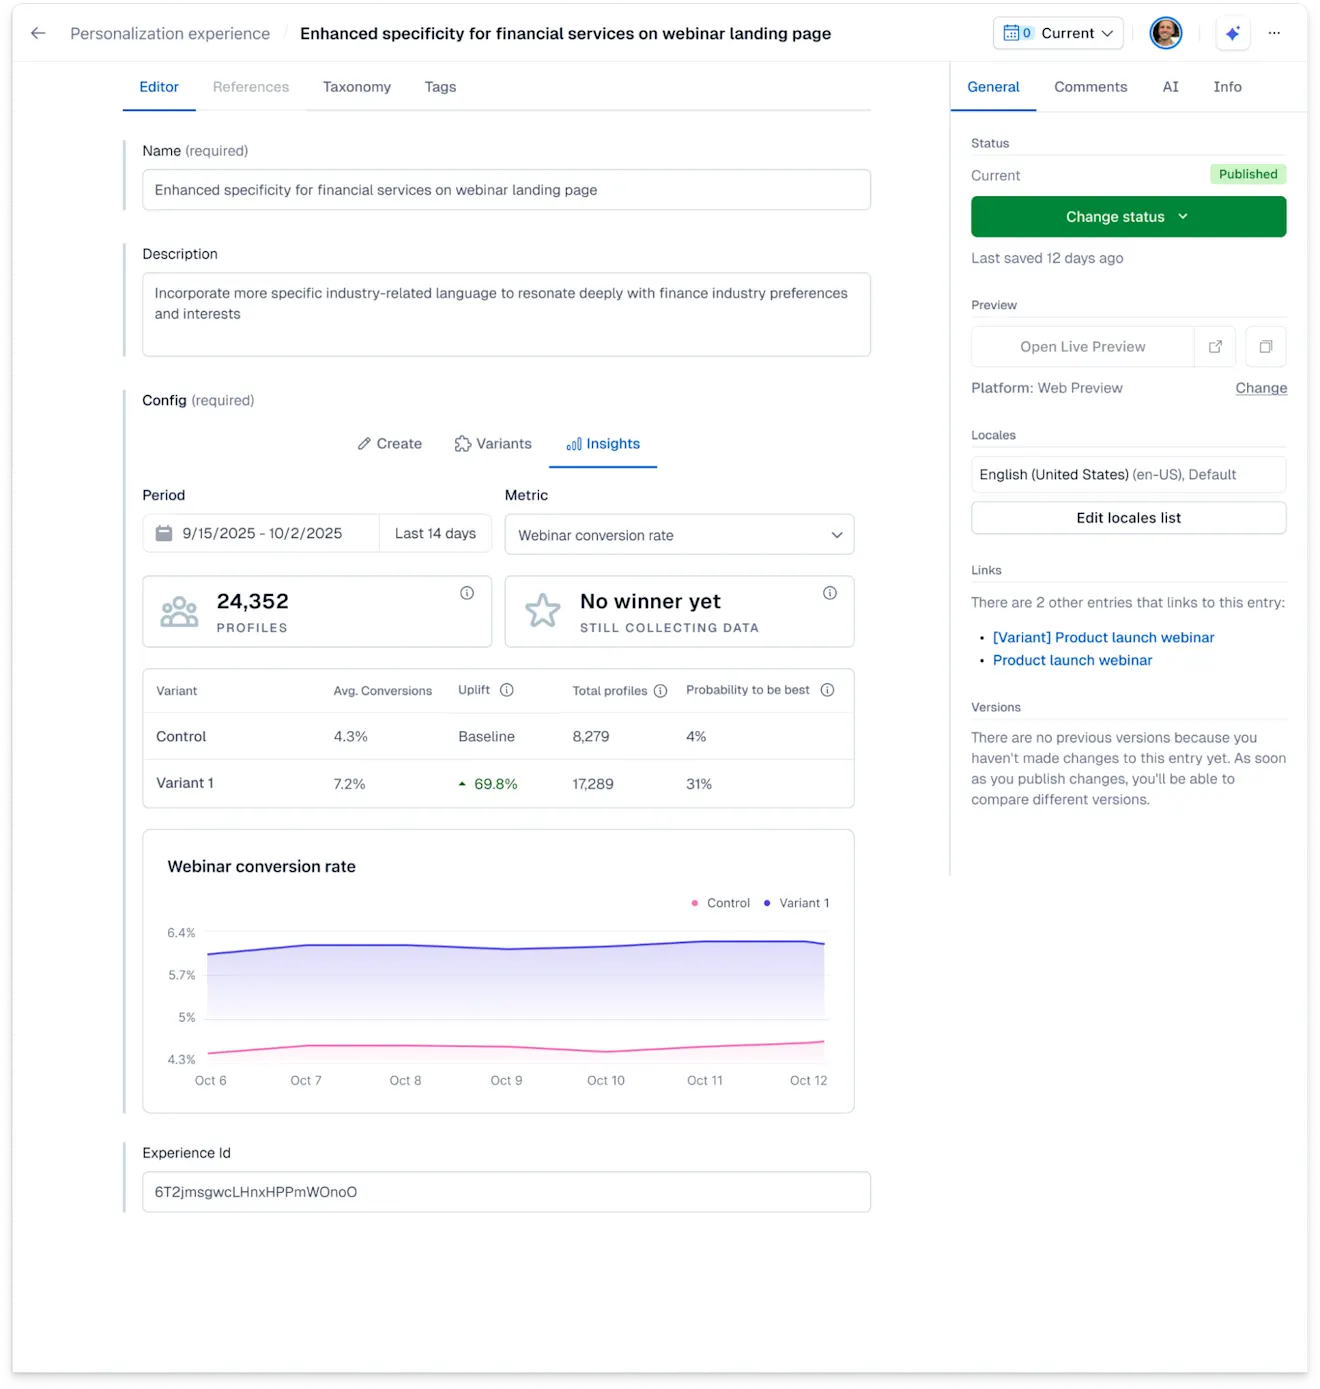
Experience Insights bietet Ihnen klare Daten für jedes Experiment oder jede Personalization, wie zum Beispiel:
Profile – Die Anzahl der eindeutigen Besucher*innen im ausgewählten Zeitraum, die die Kontrolle oder eine der Varianten gesehen haben.
Gewinnvariante – Die Variante mit mindestens einer Konversion und 100 Profilaufrufen und einer „Wahrscheinlichkeit, die Beste zu sein“ (P2BB) von mindestens 95 %.
Durchschnittlicher Konversionswert – Wird für den Kennzahlentyp Wert angezeigt. Der durchschnittliche Wert pro Sitzung/Nutzer*innen, die das Erlebnis innerhalb des ausgewählten Zeitraums und Umfangs gesehen haben.
Konversionsrate – Die Anzahl der Konversionen geteilt durch die Anzahl der Profile, die das Experiment oder die Personalization für die ausgewählte Kennzahl gesehen haben.
Außerdem können Sie die Leistung einzelner Varianten vergleichen. Jedes Erlebnis mit einer festgelegten Kontrollgruppe ist für Leistungsvergleiche berechtigt. Wir vergleichen Varianten mit Messungen wie Verbesserung und „Wahrscheinlichkeit, die Beste zu sein“ (P2BB), und geben Ihnen mithilfe der Bayesschen Inferenz klare Einblicke in das, was am besten funktioniert.
Die Daten werden stündlich aktualisiert.
So bewerten Sie die Leistung eines Erlebnisses
So bewerten Sie die Leistung von Erlebnissen:
Melden Sie sich bei der Contentful Web-App an.
Navigieren Sie zur Registerkarte „Content“ und wählen Sie den Erlebnis-Eintrag aus.
Klicken Sie auf die Registerkarte Insights.
Wählen Sie unter Zeitraum den gewünschten Zeitraum für Ihr Erlebnis aus.
Wählen Sie unter Kennzahl die Kennzahl aus, für die Sie Erkenntnisse erhalten möchten.
HINWEIS: Stellen Sie sicher, dass Sie Ihre gewünschten Kennzahlen vor Beginn eines Experiments oder einer Personalization eingerichtet haben. Sie können Kennzahlen jederzeit zu einem späteren Zeitpunkt hinzufügen. Sie sind jedoch erst verfügbar, wenn sie eingerichtet wurden.
Die Seite zeigt nun Informationen für alle definierten Varianten in Bezug auf den ausgewählten Zeitraum und die ausgewählte Kennzahl an.
HINWEIS: Als Faustregel empfehlen wir, jedes Erlebnis mindestens 2 Wochen lang laufen zu lassen, bevor Sie Entscheidungen auf der Grundlage der Leistungsanalyse treffen. P2BB passt sich jedoch automatisch an die Anzahl der Profile und Konversionen an, und je nach Traffic, den ein Erlebnis erhält, können statistisch signifikante Ergebnisse früher verfügbar sein.
So funktioniert es
Varianten
Eine Variante ist eine Verknüpfung von einem Erlebnis zu einem Contentful-Eintrag. In der Regel hat ein Erlebnis mindestens zwei Varianten:
Kontrolle – auch als „Basisversion“ oder „Kontrollgruppe“ bezeichnet. Sie verweist auf einen Contentful-Eintrag mit der Standard- oder nicht personalisierten Version Ihres Contents.
Variante 1 – Varianten referenzieren die Contentful-Einträge, die als Varianten oder personalisierter Content dienen.
Wenn Sie ein Experiment mit mehreren Varianten durchführen, werden Ihnen entsprechend mehr Werte angezeigt.
Jede Variante benötigt eine Reichweite von mindestens 100 Profilen und mindestens eine Konversion. Die Reichweite misst die Anzahl der Profile, die eine Variante im gegebenen Zeitraum erreicht hat.
Konversionsrate oder Konversionswert
Konversionen messen den Erfolg, wie viele Sitzungen oder Nutzer*innen die gegebene Kennzahl im gegebenen Zeitraum erreicht haben. Abhängig von der Kennzahl gibt es zwei Möglichkeiten, wie Konversionen angezeigt werden:
Wenn die Kennzahl eine „binäre“ Kennzahl ist, wird die Konversionsrate ausgewertet. Sie zeigt an, wie viel Prozent der Sitzungen oder Nutzer*innen das gegebene Erlebnis zuerst gesehen haben und dann das Konversionsziel erreichen.
Wenn die Kennzahl einen „Konversionswert“ verfolgt, wird der Durchschnittswert für diese Konversion angezeigt. Sitzungen oder Nutzer*innen müssen zuerst das betreffende Erlebnis aufrufen und dann das Konversionsziel erreichen. Für alle Sitzungen oder Nutzer*innen, die kein Konversionsziel erreicht haben oder das Erlebnis erst danach gesehen haben, wird der Wert 0 zum Gesamtdurchschnitt addiert.
Verbesserung
Die Verbesserung misst den relativen Anstieg oder Abfall der Konversionsrate oder des Konversionswerts im Vergleich zur Kontrollgruppe. Sie wird mit der Bayesschen Inferenz berechnet, dem Branchenstandard für statistische Experimente. In Kombination mit der „Wahrscheinlichkeit, die Beste zu sein“ (P2BB), ist die Verbesserung eine führende Messung, um Aktionspunkte aus der Analyse abzuleiten.
Reichweite
Reichweite misst die Anzahl der Profile, die eine Variante im gegebenen Zeitraum erreicht hat.
Wahrscheinlichkeit, die Beste zu sein (Variante)
Die „Wahrscheinlichkeit, die Beste zu sein“ (P2BB), misst die Wahrscheinlichkeit, dass die einzelne Variante die beste von allen gegebenen Varianten ist, und basiert auf derBayesschen Inferenz und Monte-Carlo-Simulationen. Die beiden Faktoren, die zu dieser Messung beitragen, sind dieReichweite jeder Variante und die relative Verbesserung. Daher ist die „Wahrscheinlichkeit, die Beste zu sein“, eine robuste Methode, um eine statistisch signifikante Entscheidung für Gewinnvarianten zu treffen.
Beispiel
Stellen Sie sich vor, Sie führen ein Experiment für ein paar Tage durch. Nach einigen Tagen hat es nur wenige hundert Nutzer*innen erreicht. Selbst wenn eine Ihrer Varianten eine hohe Verbesserung von 50 % aufweist, ist die „Wahrscheinlichkeit, die Beste zu sein“, möglicherweise immer noch nicht signifikant hoch.
Wenn Ihr Experiment eine große Anzahl von Nutzer*innen erreicht, aber keine Variante eine viel höhere Rate erreicht, wird die „Wahrscheinlichkeit, die Beste zu sein“ (P2BB) nicht über einen Gewinner entscheiden. In den Insights wird der Status Noch kein Gewinner angezeigt.
Bestimmung einer Gewinner-Variante
Eine Variante wird zum Gewinner erklärt, wenn sie mindestens eine Konversion und 100 Profilaufrufe und eine P2BB von 95 % aufweist. Das bedeutet, dass jede Variante, die die Anforderungen mit einer P2BB erfüllt, die gleich oder höher als 95 % ist, ein „Gewinner“-Tag erhält.
HINWEIS: Das Tag ist nur beschreibend. Experience Insights ergreift keine weiteren Maßnahmen, außer einen Gewinner hervorzuheben. Je nachdem, ob Sie die Leistung eines Experiments oder einer Personalization analysieren, können Sie unterschiedliche Aktionspunkte ableiten.
Für Experimente
Wenn eine Gewinner-Variante für ein Experiment ausgewählt wurde, möchten Sie vielleicht:
diese Variante in Ihre neue Basisversion umwandeln.
Diese neue Variante als neue Personalization verwenden.
Ein neues Experiment mit einer weiteren Variante erstellen, um weiter zu testen, was am besten funktioniert.
Für Personalizations
Wenn eine Gewinner-Variante für eine Personalization ausgewählt wurde, können Sie:
Den Kontrollgruppen-Prozentsatz verringern.
Ihrer Personalization weitere Komponenten hinzufügen, um die Verbesserung zu verstärken.
Ein Experiment für dieselbe Zielgruppe erstellen, um zu sehen, wie Sie Ihre Personalization verbessern können.