How to put your Webpack bundle on a diet
Published on December 7, 2022


Inspiration for your inbox
Subscribe and stay up-to-date on best practices for delivering modern digital experiences.
Looking to slim down your code? Webpack is a static module bundler for JavaScript applications. While it's very useful, Webpack can sometimes create unnecessarily large bundles that negatively affect application performance. Large bundles can be costly for users, for example, on a slow internet connection.
In this post, we’ll examine some tools and techniques for reducing the size of your Webpack bundle. We’ll use Moment.js and Lodash as a case study, as you’re likely to see them in a legacy application that has grown too large. Even though Moment.js has been deprecated, it still gets almost 20 million npm downloads per week.
You’ll also see how to use Babel and Webpack’s production mode to reduce your bundle size further. And while we're at it, we’ll introduce some lightweight alternatives.
Let's get started
We’ll use Webpack Visualizer by Chris Bateman to determine which modules contribute the most to your bundle’s size. When you upload a bundle’s stats file, the visualizer displays the dependency graph in your bundle as a radial tree.
To follow along in this walkthrough at a higher level, upload the stats file provided for each step. You can find all the code files for this walkthrough on GitHub.
If you prefer to build the bundle in a more hands-on approach, start by setting the mode option to development. The mode option tells Webpack how to configure its optimizations for the bundle’s intended use. Although the default value is production, non-trivial projects typically benefit from the verbose comments and the useful component names that Webpack includes in development.
The starting bundle consists of a JavaScript project with a few small files. These are the project files that will be used to generate the baseline Webpack bundle:
The only packages installed at this point are webpack and webpack-cli. As you step through each optimization, import the modules into src/index.js and trim them using the provided techniques.
To examine the size of the starting bundle, upload baseline-stats-dev.json to the Webpack Visualizer.
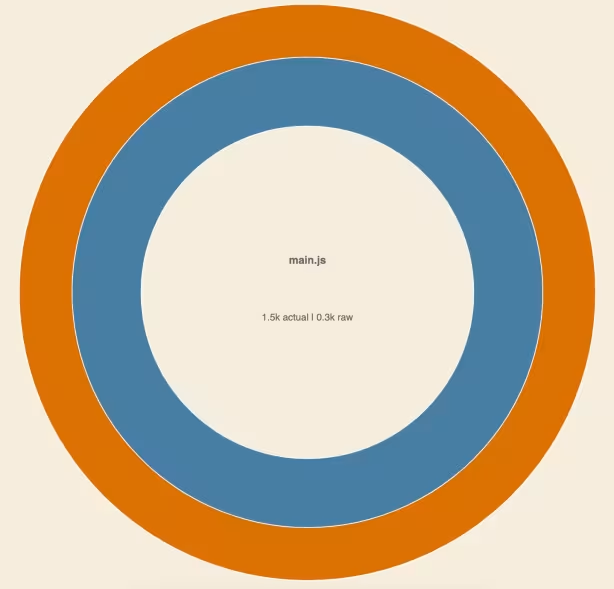
The output for your baseline bundle should have a raw size of 0.3 KiB and an actual size of 1.5 KiB. The relevant value in this demonstration is the actual size.
In the project’s root directory, create a Webpack configuration file named webpack.config.js and enter the following code into it:
Moment.js
Moment.js used to be a popular library (again, it’s now deprecated) that provided a suite of functions to generate, parse, validate, and manipulate dates and times.
It was used often in applications requiring internationalization because it included a set of locales (like en_US).
Each locale provides information about time zones and the standardized date and time formats for a particular country, letting an application manage and display dates based on a user's language.
Upload moment-stats-raw-dev.json or your equivalent stats.json file to examine your bundle:
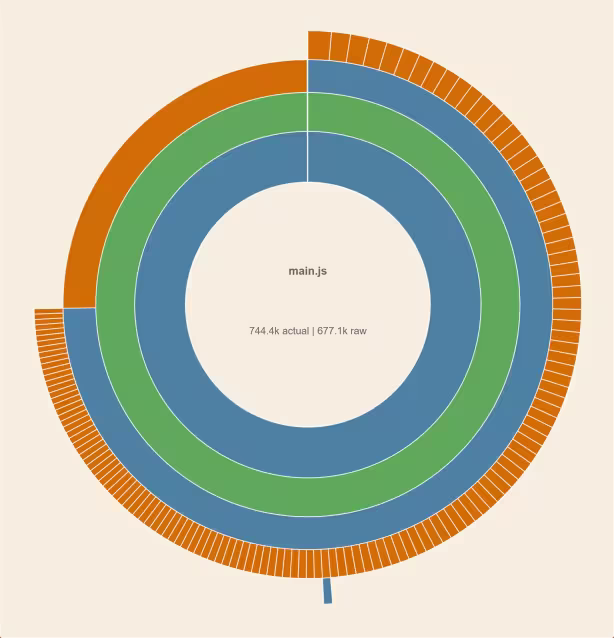
The bundle now takes up an enormous 744.4 KiB. This is because Webpack imports every Moment locale, regardless of whether it’s used, by default.
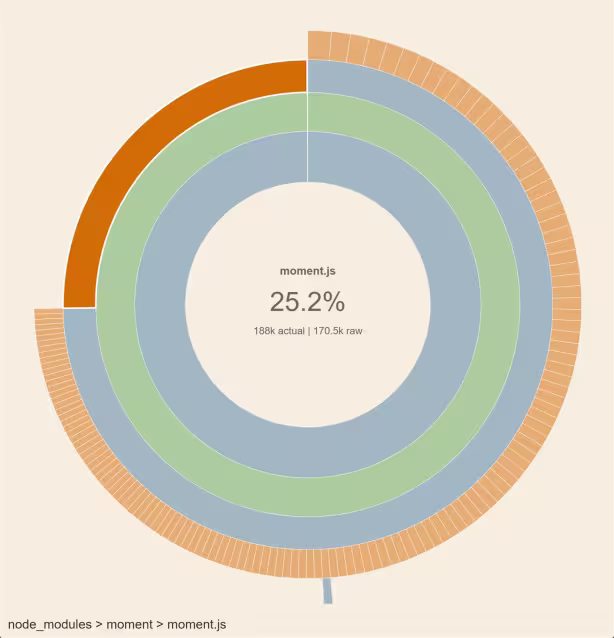
Note that the core moment.js library takes up 188 KiB — a little over a quarter of the bundle’s volume:
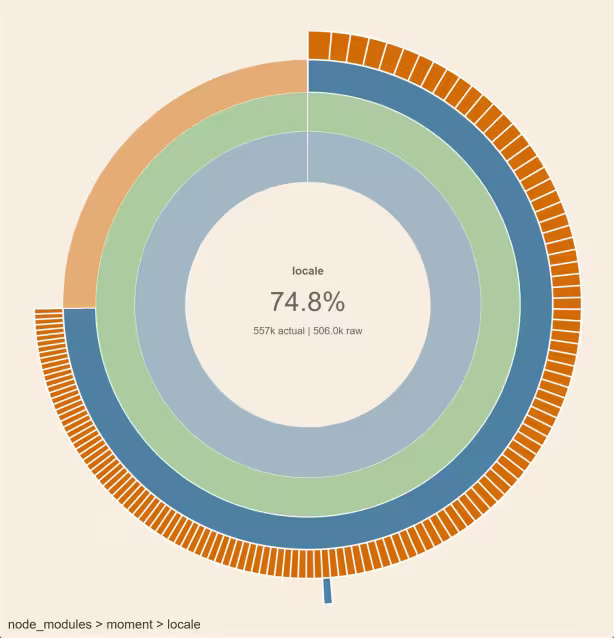
The remaining volume consists of locales, each represented by a segment of the large outer ring and belonging to the locale folder:
To reduce your bundle size, you can use Webpack’s built-in IgnorePlugin, which lets you use regular expressions or filter functions to specify which modules Webpack should skip during compilation.
Webpack automatically supplies the checkResource filter function as part of the IgnorePlugin. This filter is called for each resource that could be included in the bundle, along with its context, i.e., where that resource is located. You can specify true if the resource should be excluded or false if it should remain in the final bundle.
For example, suppose your project only applies to UK-based customers, and you only need the en-gb locale. In that case, you can ignore all the other locales by using the following configuration in webpack.config.js:
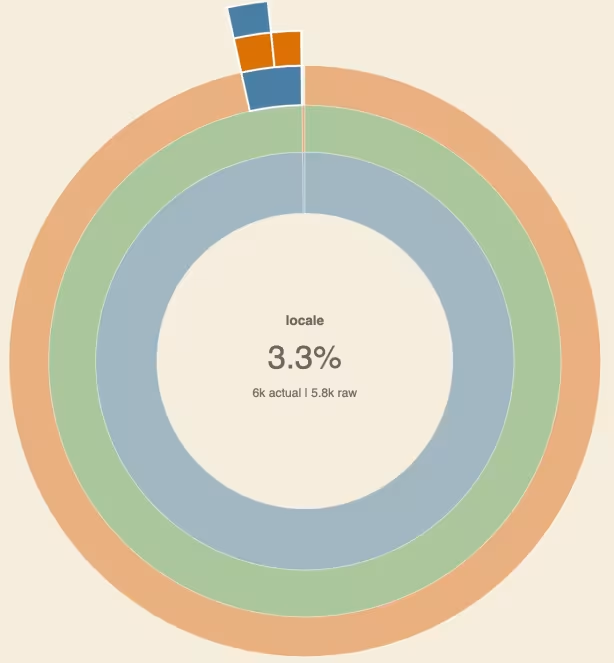
The bundle size, visualized by uploading moment-stats-locale-dev.json, is now a more manageable 183.9 KiB:
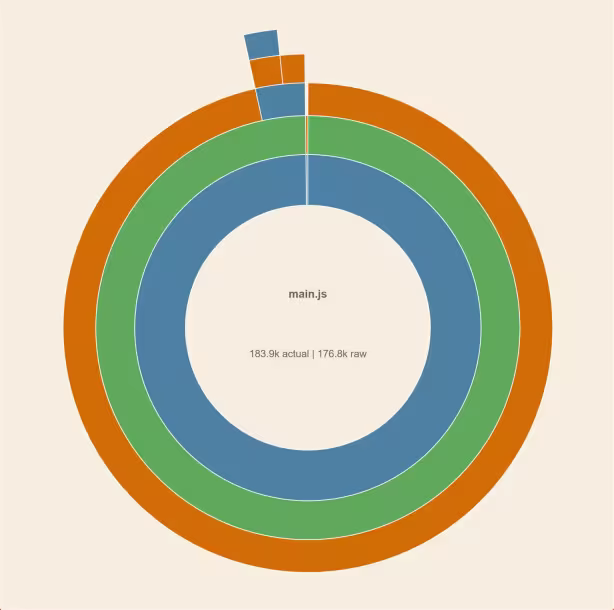
The locale module only makes up 3.3% of the overall size. Only two locales remain: One is the en-gb locale we specified, and the other is a non-country-code module.
To exclude all locales instead, set the if statement to return true.
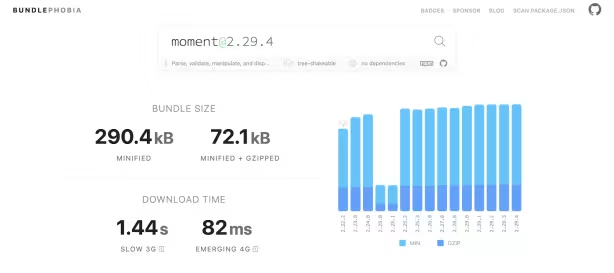
Bundlephobia shows Moment’s size to be 290.4 KiB — this is its Webpack production size, which you’ll see toward the end of this walkthrough. It also recommends alternatives, each of which is smaller in this case.
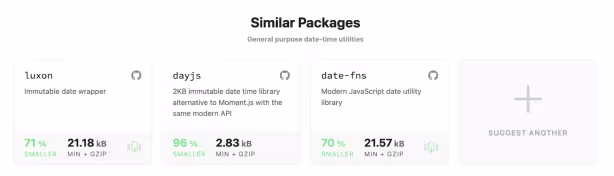
The smallest is Day.js, which is up to 96% smaller than Moment.
To see the difference using Day.js would make in your bundle, upload dayjs-stats-raw-dev.json to the visualizer.
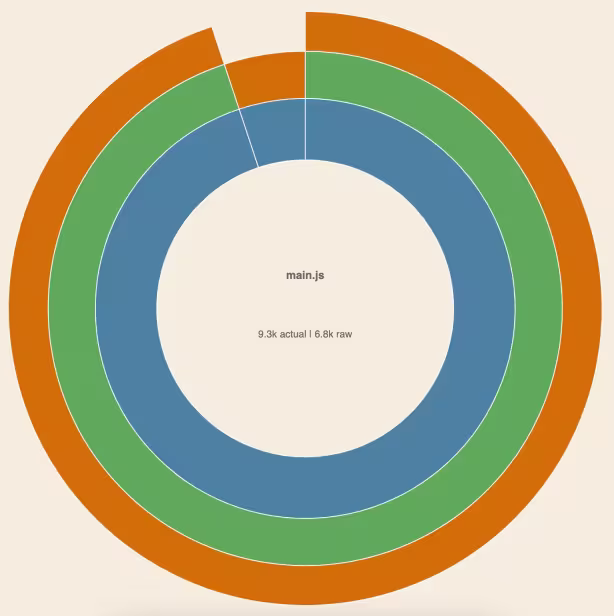
The total package size is now 9.3 KiB — Day.js is only 9 KiB. This is a colossal reduction from the 744.4k size when using Moment before removing locales, and is still a large reduction from the 183.9k without the locales.
If you have an application that deals with dates and time, replacing Moment with a lighter library like Day.js is the best way to reduce the size of your Webpack bundle.
The table below shows an overview of the size differences for each step in this section.
Version | Size in KiB |
Baseline bundle | 1.5 |
Moment.js | 744.4 |
Moment.js, en-gb locale only | 183.9 |
Day.js | 9.3 |
Babel
Babel is a "transpiler" that converts modern JavaScript into backward compatible JavaScript that can be run on older browsers. It’s useful for those looking to use the latest syntax and future-proof their code while still supporting those using alternative browsers or running older versions.
Babel also contains tools for reducing bundle sizes, especially when working with certain libraries. In the next section, you’ll see how to use Babel plugins with Lodash to reduce the bundle size.
Before continuing, make sure you have a clean copy of your baseline project.
To use Babel, first install the core Babel libraries by running the following three commands:
Then, add Babel to your Webpack configuration by modifying webpack.config.js so it contains the following code:
This tells Webpack to use the babel-loader and preset-env when generating your bundle. The @babel/preset-env preset lets you specify the target browsers without worrying about individual syntax features.
Lodash
Lodash is a popular JavaScript library that provides utility functions for parsing arrays and objects. Lodash also provides each utility function as its own package (like `lodash-debounce`) letting you only import the modules you need. Again, we’ll use the large module as a case study.
The babel-plugin-lodash module reduces the size of the Lodash export by only importing the functions used in the code.
To demonstrate this, let’s use Lodash’s _.clone function. Import it as a module with the following code:
Then call clone() from anywhere inside the index.js file. This ensures that clone() is picked up and included as part of your bundle.
To visualize the bundle without the Babel plugin, upload lodash-stats-raw-dev.json to the visualizer.
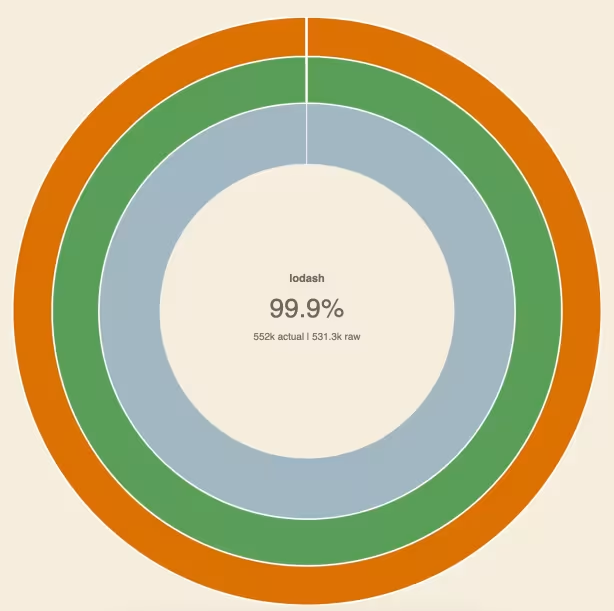
This gives you an initial size of 552.5 KiB — 99.9% of which is caused by Lodash.
Because you are only using the clone function, the rest of the Lodash library can be removed. You can do this by installing babel-plugin-lodash using the following command:
This adds the plugins property, which lets you specify an array of Babel plugins to be used. To use the babel-plugin-lodash plugin, include lodash in the plugins array in your config for the Babel loader.
In other words, add the following line to options in webpack.config.js:
Next, upload lodash-stats-babel-dev.json to the Webpack visualizer, which displays the components of Lodash required when calling the clone function.

You can see that the size has been reduced to 124.4 KiB.
You can take this one step further by using the webpack-lodash-plugin. Whereas the Babel plugin simply ensures that only the required modules are included, the Wepback plugin replaces the actual features of certain modules with smaller alternatives, reducing the size even further.
Install it by running the following command:
Then, add it as a plugin to your Webpack configuration. The whole webpack.config.js file should now look like this:
Upload lodash-stats-webpack-dev.json:
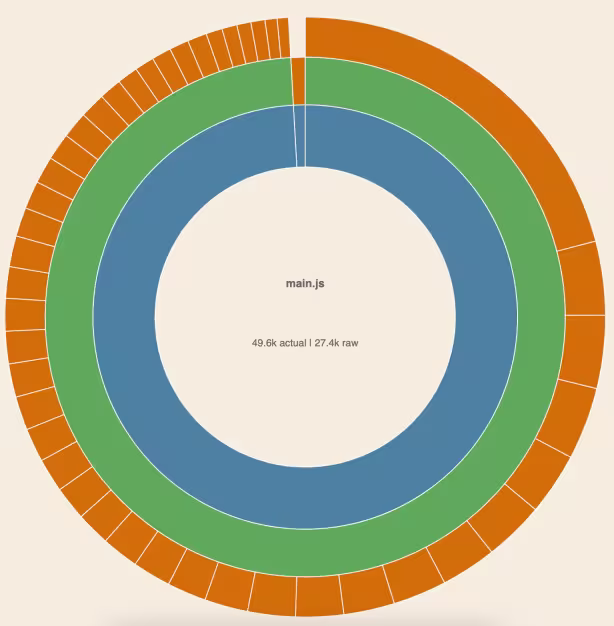
The size has been further reduced to 49.6 KiB.
The table below illustrates the changes in bundle size between importing Lodash in its entirety and trimming it down with the Babel and Webpack plugins.
Version | Size in KiB |
Baseline bundle | 1.5 |
Lodash | 552.5 |
Lodash and babel plugin-lodash | 124.4 |
Lodash, babel plugin-lodash and lodash-webpack-plugin | 49.6 |
Webpack production mode
Our final technique is to use Webpack’s production mode. In addition to other optimizations meant for a production environment, this mode reduces bundle sizes by minifying the code.
To use production mode, ensure your NODE_ENV environment variable is set to production or set the --mode option flag to production when initializing Webpack from the command line.
To see the difference this makes, compare your existing, reduced bundles for Moment, Day.js, and Lodash against the same bundles created in production mode:
Version | Development Size in KiB | Production Size in KiB |
Baseline bundle | 1.5 | 0.1 |
Moment.js | 744.4 | 290.1 |
Moment.js en-gb locale only | 183.9 | 59.5 |
Day.js | 9.3 | 6.5 |
Lodash | 552.5 | 69.3 |
Lodash and babel-plugin-lodash | 124.4 | 16.8 |
Lodash, babel-plugin-lodash and lodash-webpack-plugin | 49.6 | 6.3 |
Production mode often makes the largest difference in Webpack bundle sizing.
It’s good practice to look at ways to reduce your bundle size when developing applications and then ensure your bundle is generated in production mode before being deployed. This will happen by default if you have the NODE_ENV environment variable set up correctly across your environments.
Wrapping up
It’s important to stay mindful of module size to avoid serving large bundles, which slow your app’s load times. You saw that by applying techniques to trim large modules, we can generate bundles almost 90% smaller in some scenarios.

Inspiration for your inbox
Subscribe and stay up-to-date on best practices for delivering modern digital experiences.
Meet the authors

Alvin is a developer advocate and creative coder, formerly with Contentful. He's worked on many things like games, charts, 3D graphics, marketing sites, data visualizations, design systems, and maps.

Bulent collaborates with Contentful's customers, partners and users to publish articles that support and elevate the community.
Related articles

Ultimate starter guide to A/B testing with best practices
May 13, 2025

What is an AVIF image? The AVIF image format explained
May 7, 2025

Rust and TypeScript: A comprehensive guide to their differences and integration
December 4, 2024
