Graphviz example: How to visualize structured content
Published on May 4, 2018


Inspiration for your inbox
Subscribe and stay up-to-date on best practices for delivering modern digital experiences.
No matter whether I am working as a content modeller and developer, or as a content creator on one of my pet projects, too often I wake up in a cold sweat in the middle of the night — wondering how all my content fits together, if it’s well-structured, nested too deep or too shallow, and how many hidden circular references have sneaked into it over time. How would all those entities — entries and assets — look if drawn on one big board, in a nice comprehensible manner?
Why not draw a graph?
That’s when I remembered Graphviz. It’s an open-source graph visualization software that allows you to render beautiful graphs with very little effort through a compact domain-specific markup language; similar to Markdown but for visualizing directed graphs. I have used it in the past for a system I created for game developers to produce content specifically for role playing computer games (RPGs) to draw the story lines, quests and non-player characters (NPCs) that the player would encounter throughout the game. It helped those game developers immensely to keep the bigger picture in mind when working on a specific part of their game’s content.
The last time I worked with Graphviz must have been about five years ago. It’s an open source project and after looking around the web a bit, I was glad to see the project is still maintained and that people are still using it even today. Not bad, considering it has been around since at least 1991. Even though their website feels — and probably is — a bit 90’s and hasn’t changed a lot since I last saw it, it still gives a broad and helpful overview of examples, and offers some extensive documentation that a good portion of today’s software projects could still learn from. I even found a project which uses Graphviz to render Contentful content models. That was enough convincing for me! I would attempt to use Graphviz to render what some of my spaces and their content looked like so I could get some clarity on how huge a big ball of mud my structured content had really grown into.
The first step involved is getting familiar with Graphviz’s graph description language called "DOT". By clicking on any of the gallery examples on their website, you can see how the markup and rendered graphs look like. Peeking at some of those examples, I was quickly able to build a first basic graph:
The resulting graph looks like this:
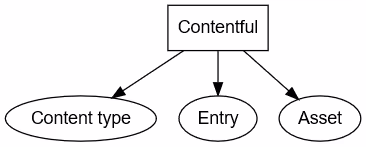
You can try it yourself by pasting the above DOT markup into Viz-js, which allows you to render the diagram and play with the markup online. There’s no need to install Graphviz here, you don’t even need to have any programming skills to generate a useful little diagram with this; it’s all really simple and the markup is pretty straightforward.
Let's get more ambitious and draw a graph to explain the basic entities that make up our structured content in Contentful:
The rendered graph looks like this:
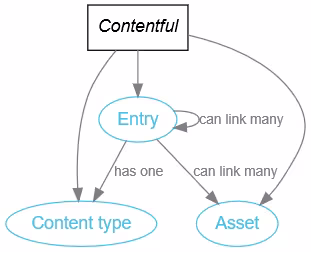
Let's summarize the basics of the DOT markup language that we have applied here:
ct [label="Content type"]defines a node with ID "ct" and draws it with the given labelEntry -> ct [label="has one"]draws a directed edge with a label between two nodesSquare brackets allow styling of related attributes on nodes and edges
node [...]andedge [...]are special keywords that allow you to define styling for all subsequently-defined nodes and edges
Why not generate a graph?
We started out with the idea of visualizing all structured content of a Contentful space as a graph. With the knowledge we have gathered about Graphviz in the previous section, we could just write down all of the markup to achieve that goal manually. Of course, this does not scale. Generating the markup programmatically on the other hand does — no matter whether a space has ten, fifty or over a thousand entries and assets.
This blog post’s code is available in a GitHub repository with one branch blog-post/step-<n> for each of the following steps.
Step 1 - Exporting the content
For visualizing a complete Contentful space, we will have to export that data first. Fortunately, there is the Contentful export tool on GitHub. We will use it to generate a json file of the Contentful space we want to generate the graph for:
After running the command, we can view the exported data in space.json. I decided to write the program in JavaScript using node.js and Lodash as only helper.
The first step is to read the exported space so we can work with the data:
buildGraphDOT()’s spaceData holds the properties contentType, entries, assets and locales which are essential for the next steps.
Step 2 - Entries and assets as nodes
We can now iterate over all exported entities (assets and entries) and create a node for each entity in DOT. To display a meaningful label for each node, instead of just showing the entity’s ID, we can use the title field in case of assets. For entries we have to look at its content type’s displayField which holds the id of the entry’s field that serves as a meaningful label. Since Contentful supports multilingual content, we will settle for the space’s default locale.
Step 3 - References as edges
Instead of just rendering each entity as a node, we actually want to see how all of them are interconnected by our entries’ reference fields.
There are two ways to get the reference fields:
Look at the entry’s content type and pick all fields of
type: ‘Link’ortype: ‘Array’anditems.type: ‘Link’Look at the entry’s field values (single value or array values) that have a
sys.type: ‘Link’
While the first solution might better scale for larger spaces, we choose the latter to keep things simple:
The result
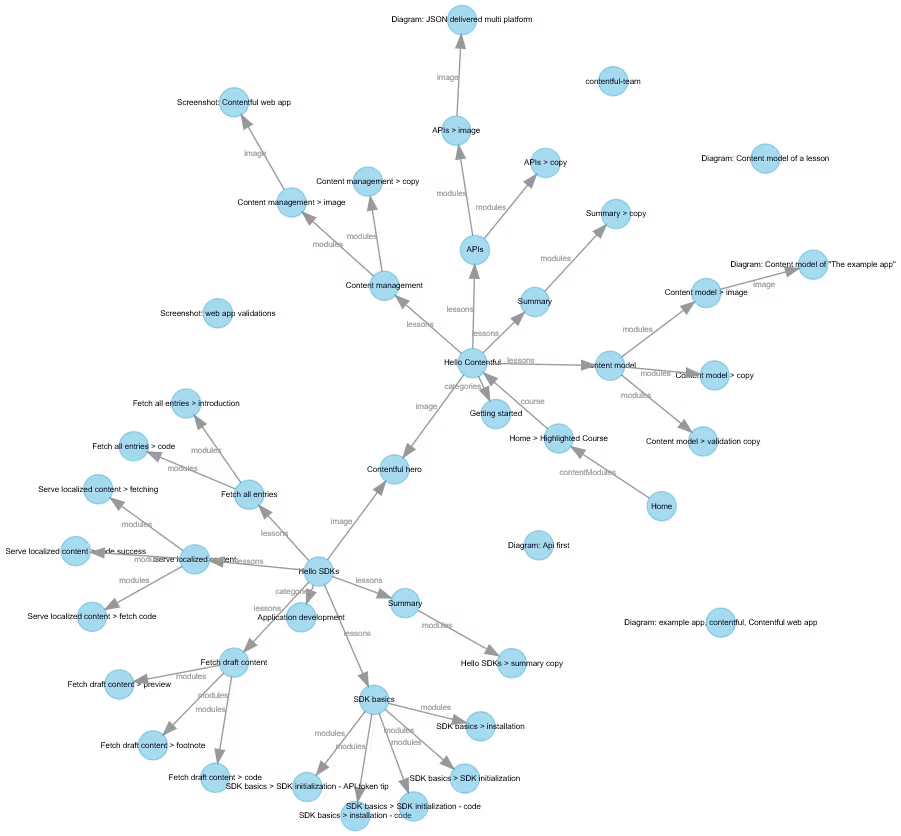
To get a more stylish output, we can add some advanced formatting options to our dotGraph() helper:
The generated svg on Contentful’s example app space would now look like this:
Using local graphviz command
If you want to render a graphviz graph without copy pasting it to Viz-js, simply install Graphviz locally to get the dot command. You can then run:
Instead of -K neato, any other Graphviz layout engine, like dot, fdp or circo,
can be used to influence the layout of the generated graph. In general, dot is a good choice for graphs that mostly resemble tree structures — not too broad and without a lot of circular references. neato shows good results on medium size graphs with up to 1,000 nodes while fdp does well in generating graphs with even more nodes than that.
Next steps
With the code created in this article, you have a solid base to build upon. You will probably notice that you might want to slightly adjust the graph output, maybe render entries of a certain content type bigger than others, or exclude entities that have no incoming references.
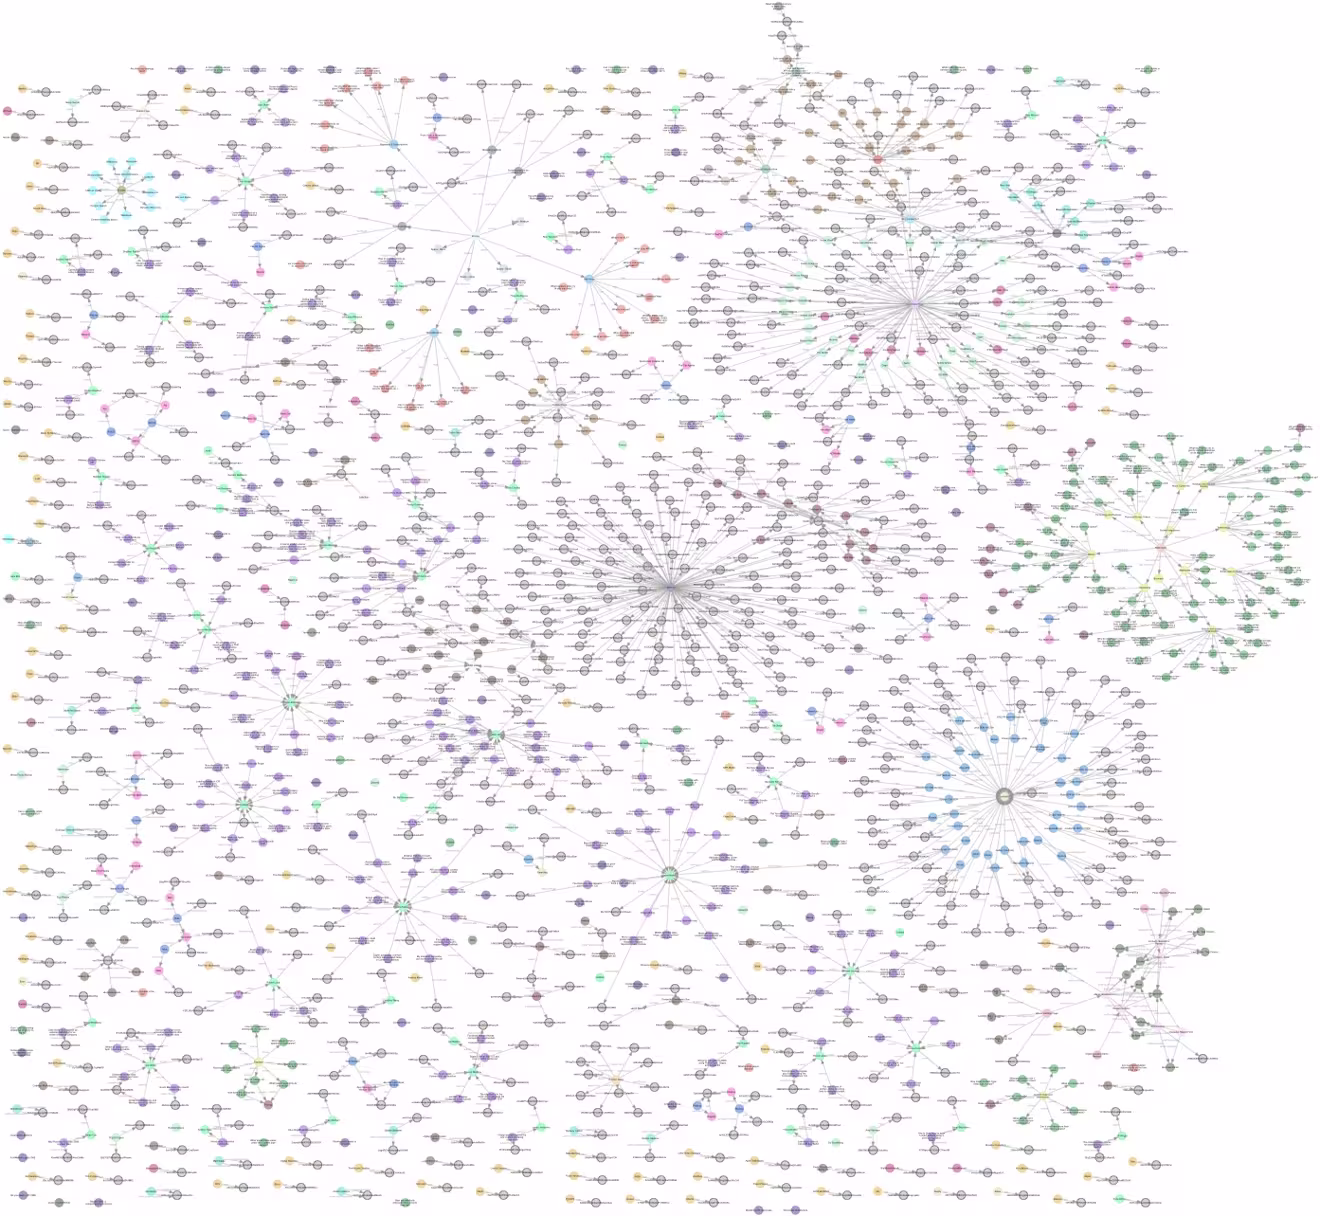
I have a more advanced version of the code in the master branch of the GitHub repository accompanying this blog post. It renders labels a bit nicer and introduces different colors depending on the content type.
Applied to our very own Contentful space powering contentful.com, the resulting graph looks like this:
Let us know what your Graphviz examples look like!
All it takes to draw a graph like the above is a data source for your structured content goodness and a library like Graphviz to render it.
Did you build something similar, perhaps with another library like sigma.js or D3.js, or did you play with the provided code and let it run wild on some of your content? Whatever the outcome, I would love to hear about it and would be grateful for a mail to danwe@contentful.com or if you’d get in touch on www.contentful.com/slack.
Inspiration for your inbox
Subscribe and stay up-to-date on best practices for delivering modern digital experiences.
Meet the authors

JavaScript Frontend Developer
Related articles

GraphQL pagination: Cursor and offset tutorials
October 28, 2024

What is Nuxt Nitro? The server engine behind Nuxt
November 17, 2025

What is server-side rendering? A complete guide with code examples
March 23, 2025
