Simple data visualization using Astro and Contentful
Published on February 6, 2024


Inspiration for your inbox
Subscribe and stay up-to-date on best practices for delivering modern digital experiences.
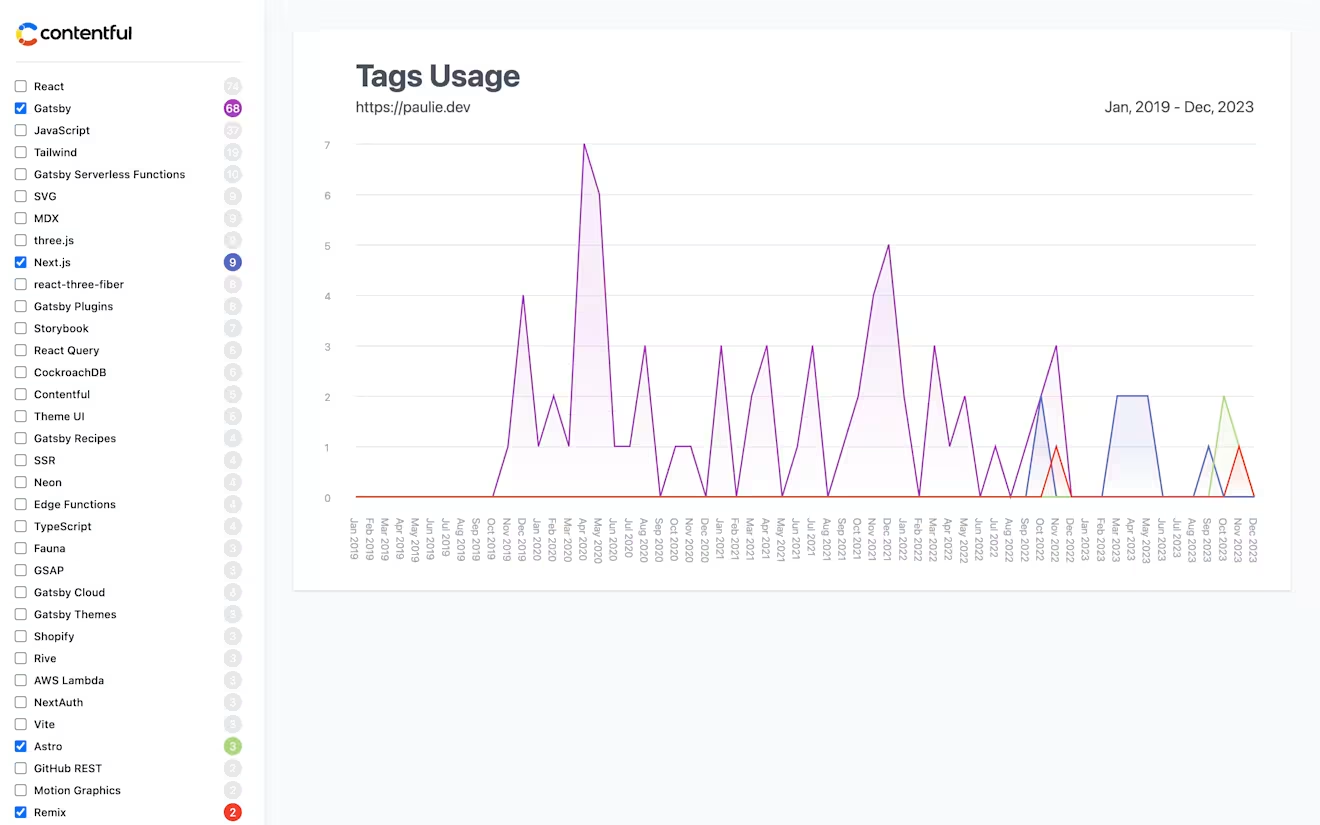
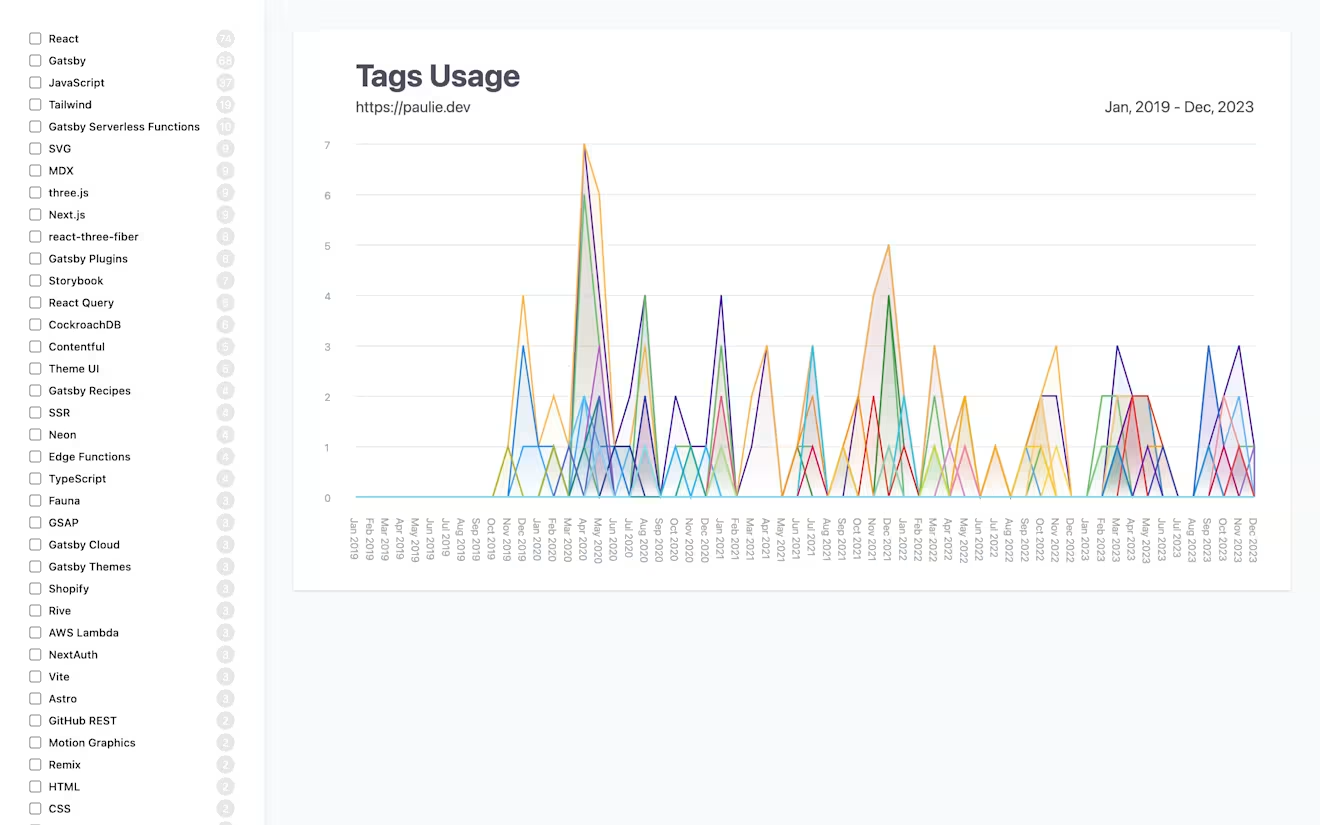
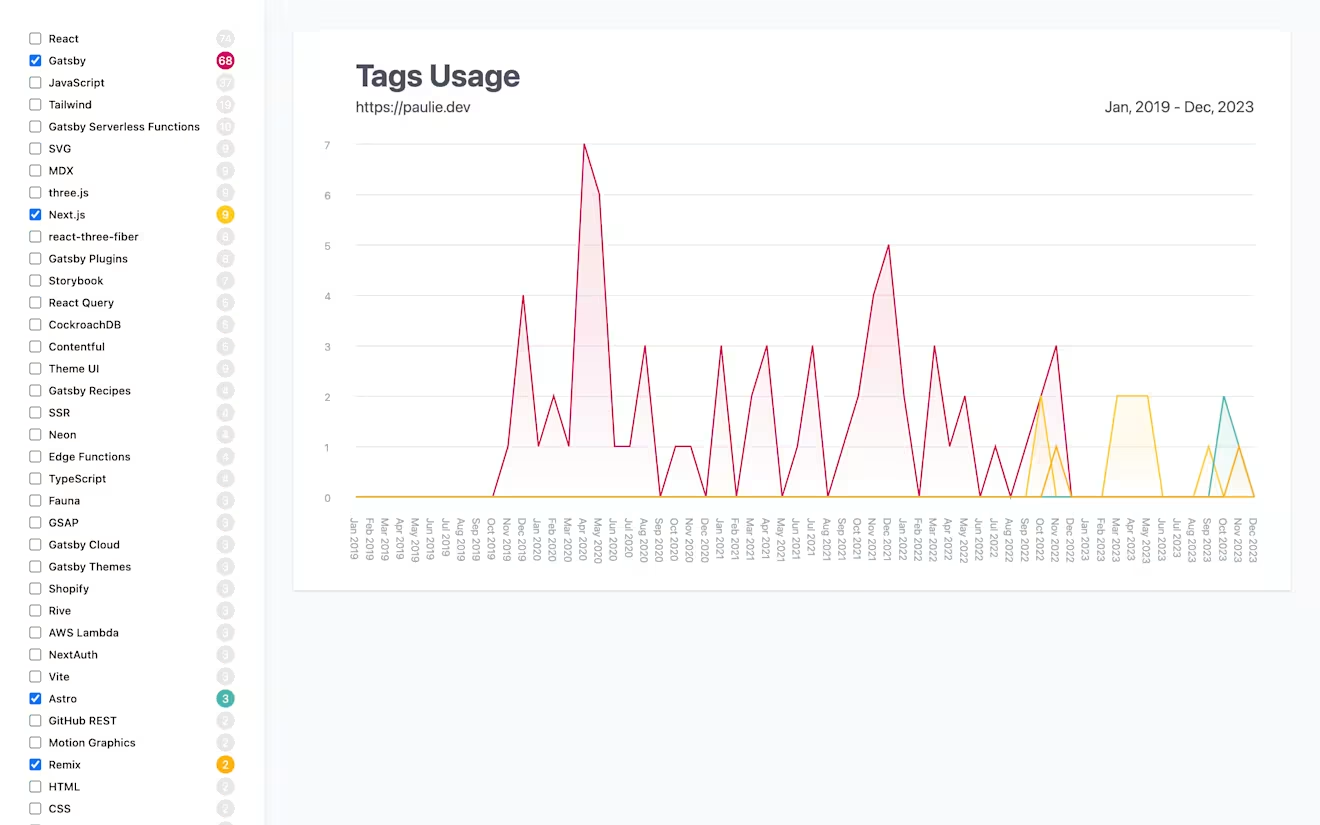
In this post I'll show you how I created a time series chart to display tag usage from blog posts published on my site paulie.dev. I was curious to see what I'd been writing about over the last few years, where the crossovers were, and if I could learn anything new.
All the data sourcing and calculations required to create a time series chart are handled by Astro on the server with only a very tiny amount of client-side JavaScript to enable interactivity.
You can see the finished demo and all the code on the following links.
Data sourcing with Astro and Contentful
This guide assumes you’re already using Contentful, but if you are looking to get started, the two links below are worth a look.
Assuming you have the Contentful client configured to fetch data, you will be able to query your entries using something similar to the code below. In my content model, the blog posts are of content type blogPost.
The output of this query will look similar to the one below, but naturally yours may differ as our content models will likely be different.
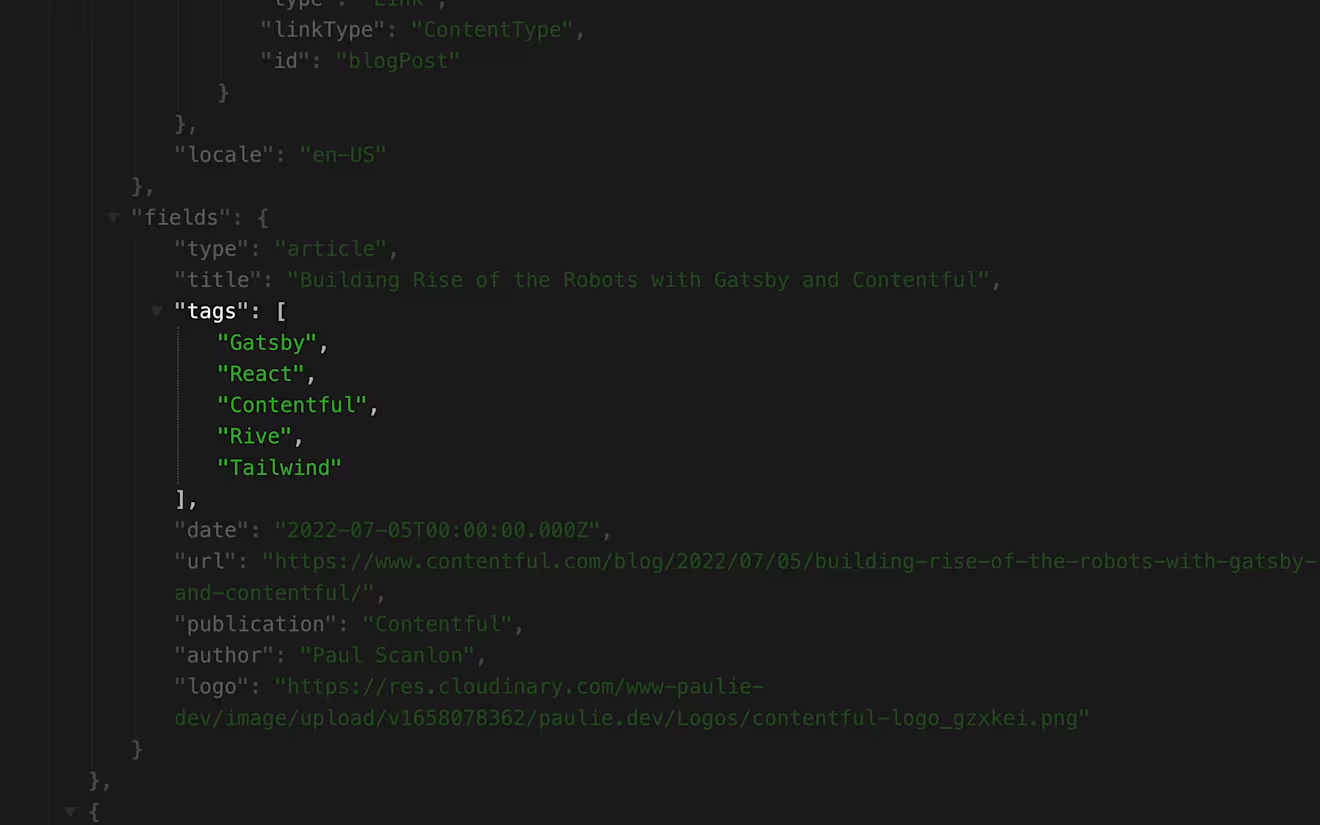
The only field that really matters though, is the tags field which is an array of strings.
You can see what the response of this query looks like in my demo site here: https://contentful-tags-data-viz.netlify.app/raw-tags/. And you can find the src for this page in the repo here: src/pages/raw-tags.astro
Create time series data
To create a time series from a Contentful response, there’s a couple of things that need to happen.
createDefaultMonths
The first is to ensure that each tag has the complete set of months and years from the data set. Even if a tag wasn’t used in any given month of any given year, a count value of 0 will still need to be created. I’ve achieved this using the createDefaultMonths function.
createTimeSeries
The createTimeSeries function can now deal with grouping each tag, creating an object to hold the dates for each year and then incrementing the month counts if the tag has been used in any given month of the year.
The output of the function will produce a result similar to the below, with a new object being created for each tag and a full array of months for each year in the data set. My data set runs from 2019 to 2023.
You can see what the response of this function looks like in my demo site here: https://contentful-tags-data-viz.netlify.app/time-series/.
And you can find the src for the complete function here: src/utils/create-time-series.js.
With the time series data in the correct shape, you can now move on to creating the chart.
Creating an SVG line chart
Creating charts is often something folks will use a library for, but I prefer the hand-cranked approach for two reasons.
I have full control over the styles.
I can render them on the server.
In the following steps, I'll explain the various functions required to transform the time series data into data that can be used to create a line chart.
To get started, create a new page somewhere in your Astro project and add the following:
findMaxValue
This function is responsible for, you guessed it, finding the maximum value from the time series data. Without this I can’t determine the ratio of any of the lines used to represent the count values of each tag.
You can see the src of this function here: src/utils/find-max-value.js.
You can now update your page to use the function.
getDateRange
This function returns a flat array of all the dates which allows me to find the earliest and the latest date from the data set.
You can see the src of this function here: src/utils/get-date-range.js.
You can now update your page to use the function.
getValuesRange
This function returns a flat array of all the values which allows me to create the values displayed on the y-axis.
You can see the src of this function here: src/utils/get-values-range.js.
You can now update your page to use the function.
Chart style variables
These variables are to control the size of the chart and the padding values for the top, left, bottom, and right, and a font size variable for the x-axis that displays the dates.
Add the following variables to your page.
createLineChartPoints
This function is responsible for turning the time series data into a series of points that can be used to populate an SVG polyline element. The function accepts a number of parameters that are used to calculate the x and y values for each point in the polyline.
You can see the src of this function here: src/utils/create-line-chart-points.js.
materialsColorsFlat
This function and its values are somewhat optional, but I need to apply a color to each of the polyline elements. To achieve this, I asked ChatGPT to provide me with a range of Material Design colors, and then created a function to “shuffle” them and another function to flatten the array so I can more easily grab a color at random.
You can see the src of this function here: src/utils/material-colors.js.
You can now update your page to use both functions.
createXAxis
This function is responsible for creating the dates and x positions used to display the dates at the bottom of the chart.
You can see the src of this function here: src/utils/create-x-axis.js
You can now update your page to use the function.
createYAxis
This function is responsible for creating the value ranges seen on the left of the chart and providing y positions of where to position the values.
You can see the src of this function here: src/utils/create-y-axis.js
You can now update your page to use the function.
createChartGuides
This function is responsible for creating points that will be used to create the chart guides. The function accepts similar properties to the createLineChartPoints function and uses the parameters to determine the x and y positions of the guides.
You can see the src of this function here: src/utils/create-chart-guides.js
You can now update your page to use the function.
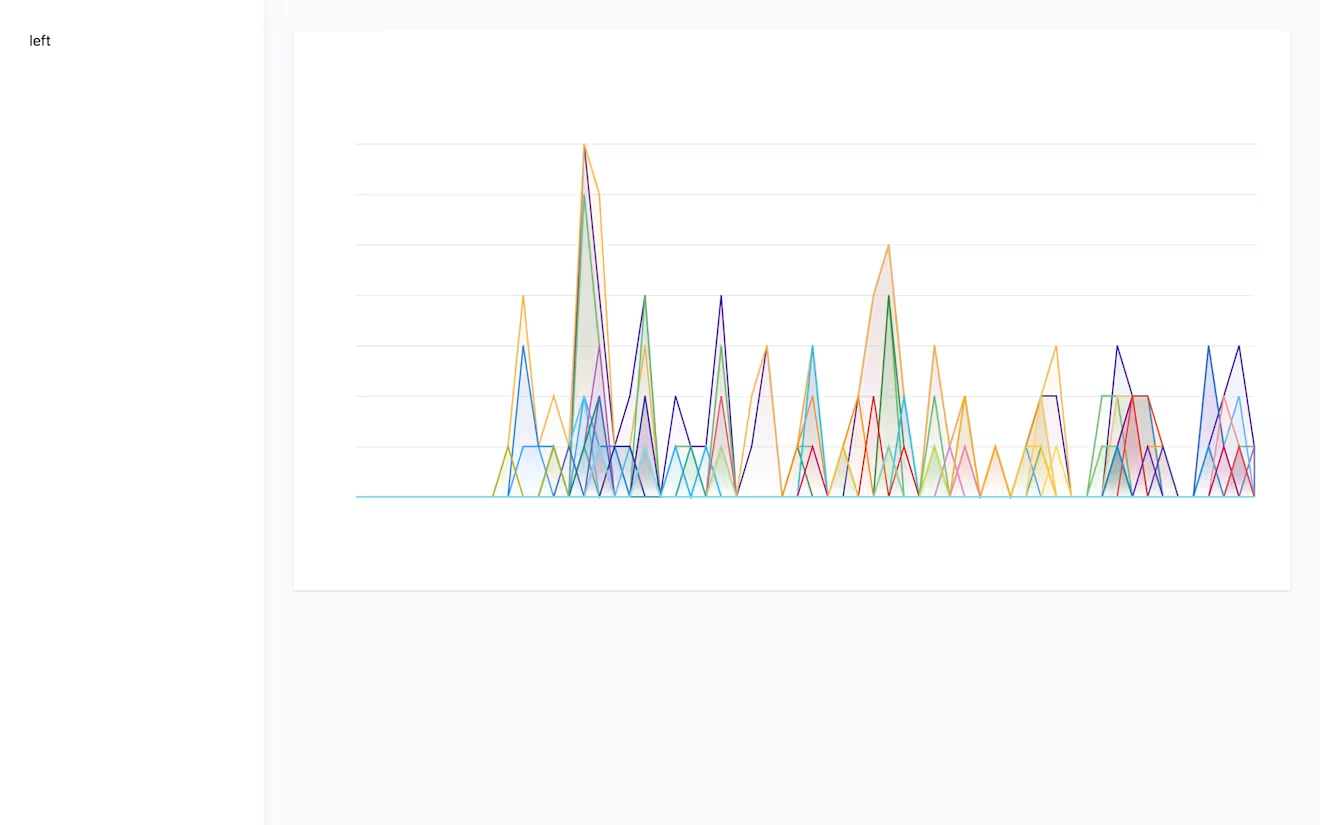
That concludes the “data wrangling” part of this post. Now it’s time to turn that data into something you can see!
Like this.

For the next set of code snippets I won’t be including all the “data wrangling” in the diff. Instead, I'll only include Astro’s opening and closing server-side code fences.
Create the page layout
The first step involves setting up some HTML to hold both the checkbox list (on the left) and the SVG chart (on the right).
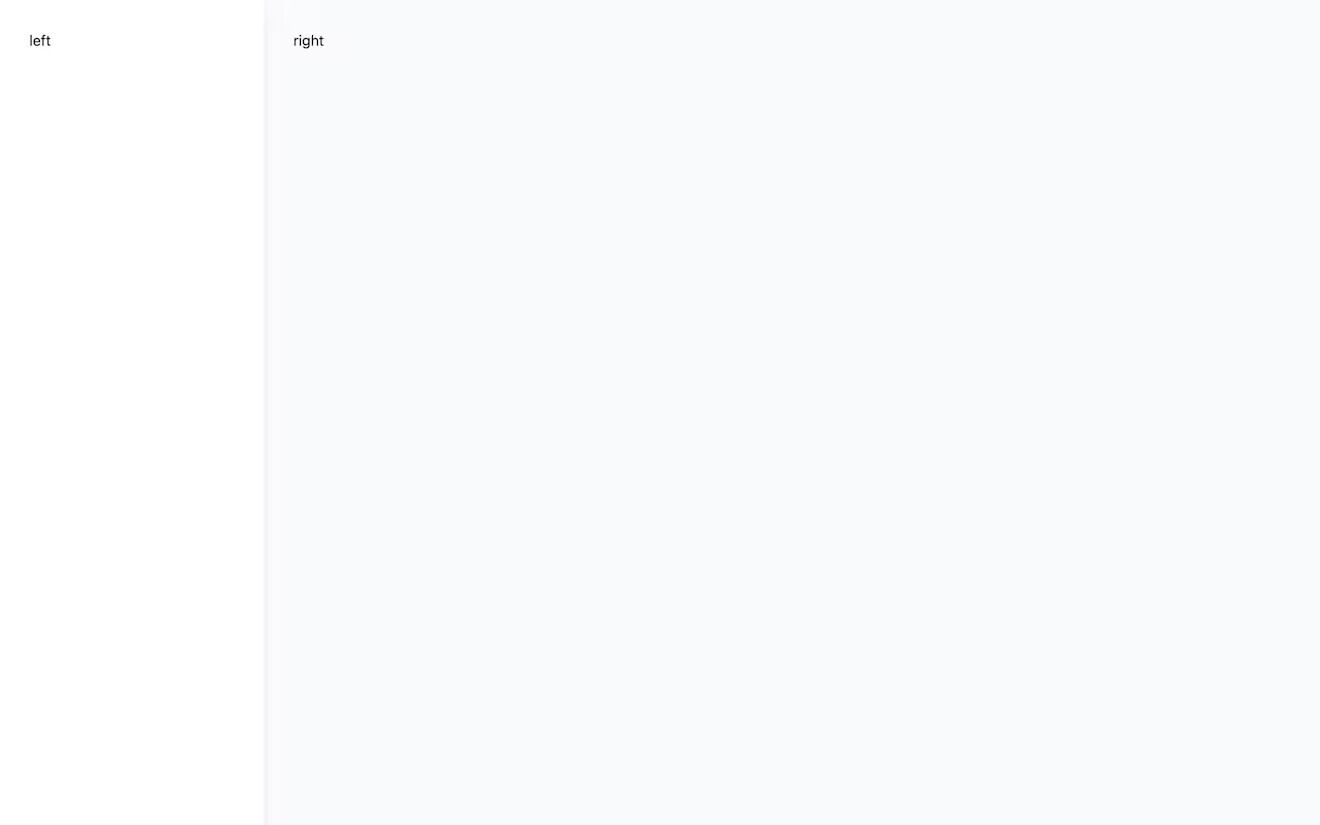
Add the following code to your page.
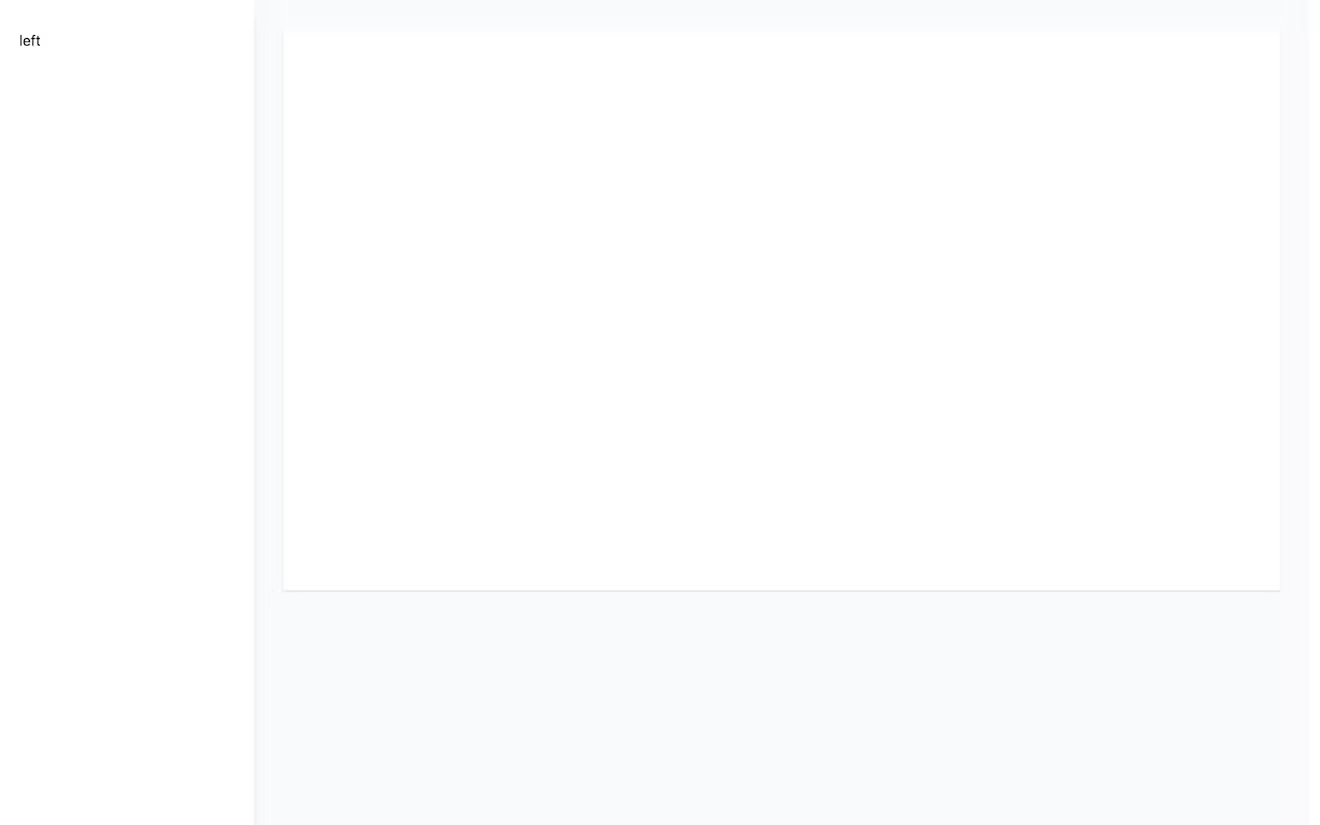
Create the SVG line chart
Now you can add the SVG element to the “right” section. The view box values for chartWidth and chartHeight are the variables defined earlier.
Add the guides
Adding the guides involves mapping over the chartGuides array and returning an Svg <rect /> element for each guide.

You can find a highlighted code snippet of the code to add using this link: src/pages/finished.astro#L144-L150
Add the chartData
To display the data you can map over the chartData and return an SVG <polyline /> and provide the points attribute with the calculated positions. I’ve also given the <polyline /> element some stroke and fill styles including a reference to a <linearGradient />.
You can find a highlighted code snippet of the code to add using this link: src/pages/finished.astro#L152-L176
Add the x-axis
The x-axis is used to display the dates which are positioned at the bottom of the chart.
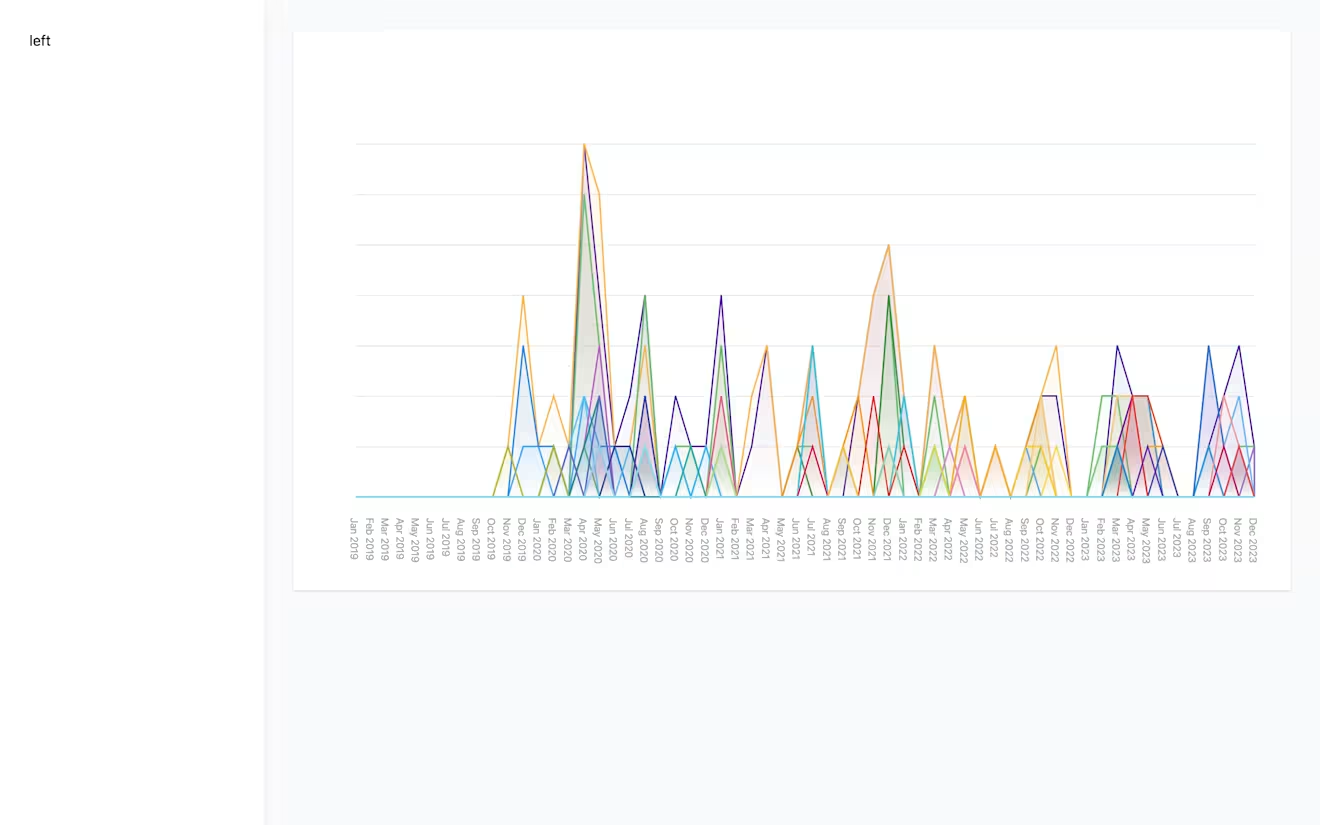
You can find a highlighted code snippet of the code to add using this link: src/pages/finished.astro#L178-L198
Add the y-axis
The y-axis displays the values starting at 0 up to the maximum value from the data set and are displayed to the left of the chart.
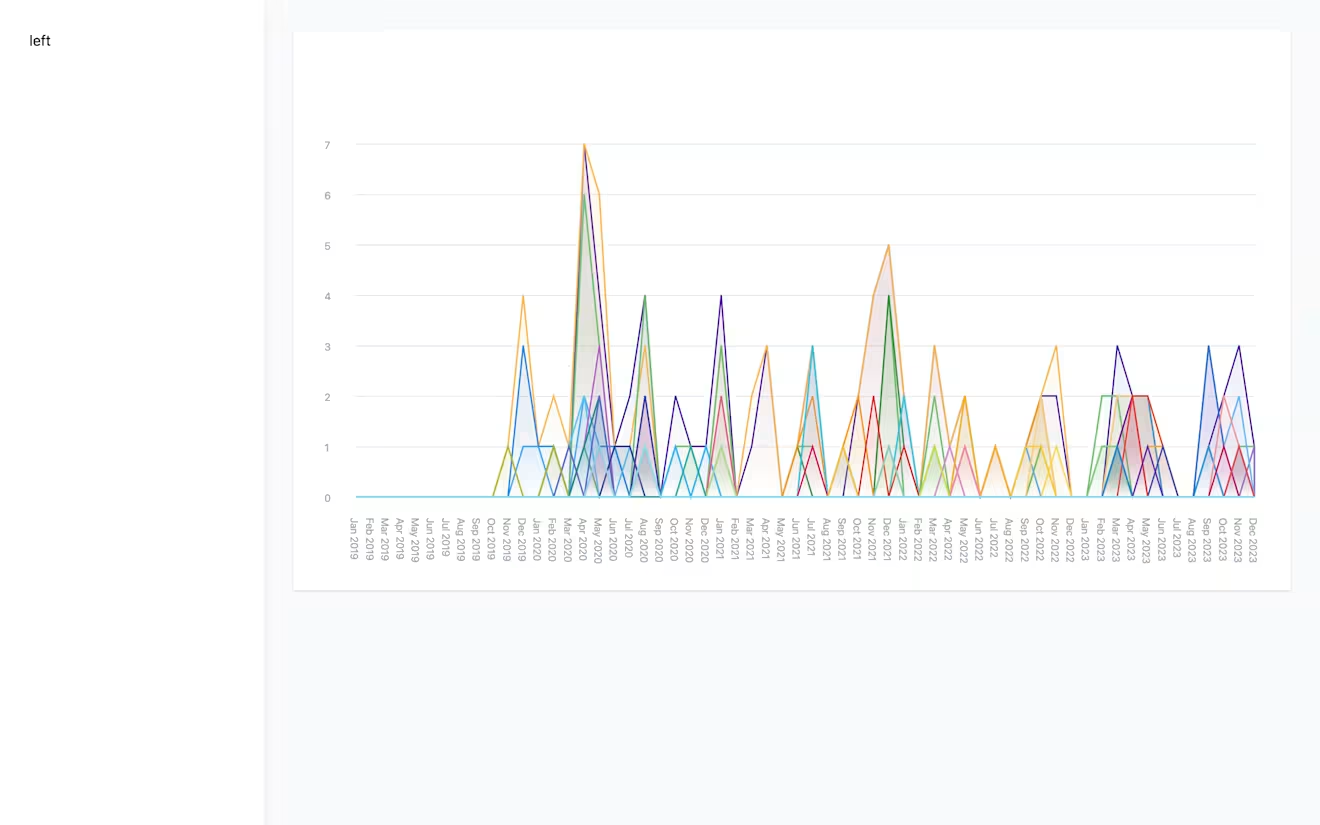
You can find a highlighted code snippet of the code to add using this link: src/pages/finished.astro#L200-L218
Add the titles
The last step is to add the chart title, and date ranges.

You can find a highlighted code snippet of the code to add using this link: src/pages/finished.astro#L220-L253
… and et voilà! That’s the chart fully complete.
Creating the checkbox list
Now you can add the HTML checkbox list to the “left” section.
You can find a highlighted code snippet of the code to add using this link: src/pages/finished.astro#L107-L134
...one more step and we’re done!
Adding interactivity
There’s a couple of things I've achieved using a tiny bit of client-side JavaScript.
The first is to provide a list of “selected values.” This array holds the tag names that are of most interest to me and are used to display the corresponding SVG <polyline /> elements.
The remaining JavaScript is to handle what happens when each of the checkboxes is checked, or unchecked, which shows or hides the corresponding SVG <polyline /> element.
You can find a highlighted code snippet of the code to add using this link: src/pages/finished.astro#L70-L101
… and there you have it, an SVG time series chart displaying tag data with an interactive checkbox list.
You can see this all working in my demo site here: https://contentful-tags-data-viz.netlify.app/finished/.
And you can find the src for this page in the repo here: src/pages/finished.astro
Final thoughts
Given this data is from my site, and I know what I've been writing about, I kinda already knew what the data might look like. I know, for instance, that I stopped writing about Gatsby and started writing about Astro and Remix, but content teams often have many contributors and no single person will necessarily know what content is being created, plus, people come and go and leave companies but the content remains.
Having a way to provide an overview of what’s been written will no doubt provide someone, somewhere, with valuable information to structure the next wave of content, and it’s all thanks to the humble SVG line chart.
I have a number of other posts relating to data visualization on my site and if you have any questions relating to this post, please feel free to reach out on Twitter/X: @PaulieScanlon.
Cheerio for now!

Inspiration for your inbox
Subscribe and stay up-to-date on best practices for delivering modern digital experiences.
Meet the authors

Paul Scanlon
Software Engineer & Independent Advocate
Paul sits somewhere between product marketing and developer advocacy. He specializes in the creation of high-quality technical content for educational and promotional purposes.
Related articles

WordPress to Contentful migration: Benefits, tips, and best practices
May 21, 2025

How to render and edit Markdown in React with react-markdown
July 3, 2025

What is vibe coding? Moving fast (and not breaking things) with AI assistance
February 3, 2026

Ready to start building?
Put everything you learned into action. Create and publish your content with Contentful — no credit card required.