Content insights
Overview
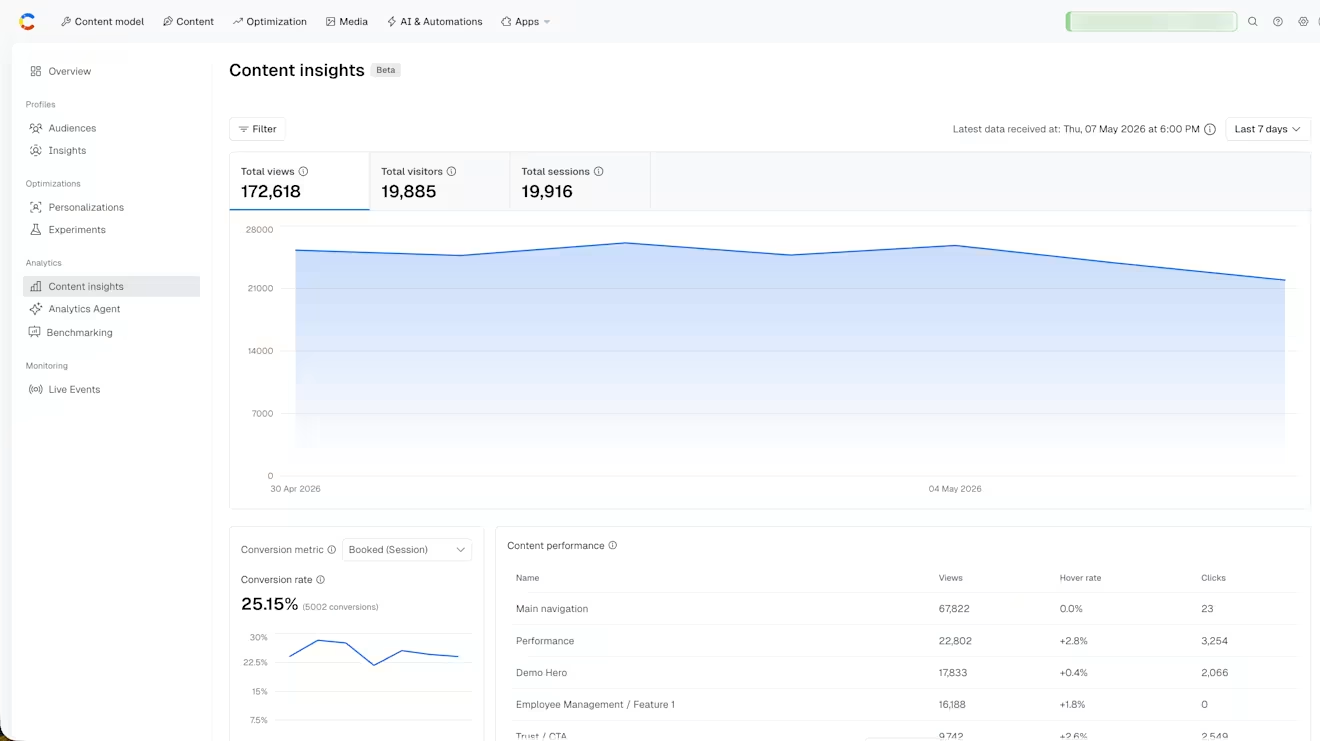
The Content insights page represents an overview of how a specific piece of content is performing within Contentful Analytics. It displays high‑level engagement metrics for that content over a selected timeframe.
With Content insights, you can analyze content performance and audience behavior to identify engagement patterns and tailor your content, and optimize it to drive deeper interest, engagement, and higher conversion rates.
You can access the Content insights page from the Optimization hub.
NOTE: To benefit from the most recent features, we recommend installing the latest version of the Experience SDK.
About Content insights
The data displayed in the Content insights consists of:
Total views – The number of times your content entries have been viewed.
Total visitors – The number of unique visitors that have viewed your content at least once.
Total sessions – The number of sessions initiated by users, including repeated visits.
Conversion rate – The percentage of engaged users who completed a desired action based on the selected Conversion metric (out of all the users that engaged with your website or app, what percentage converted).
Content performance – The measurement of how your content drives user engagement based on views, hover rate and clicks. Using this data, you can identify engagement patterns and optimize content to drive higher conversion rates.
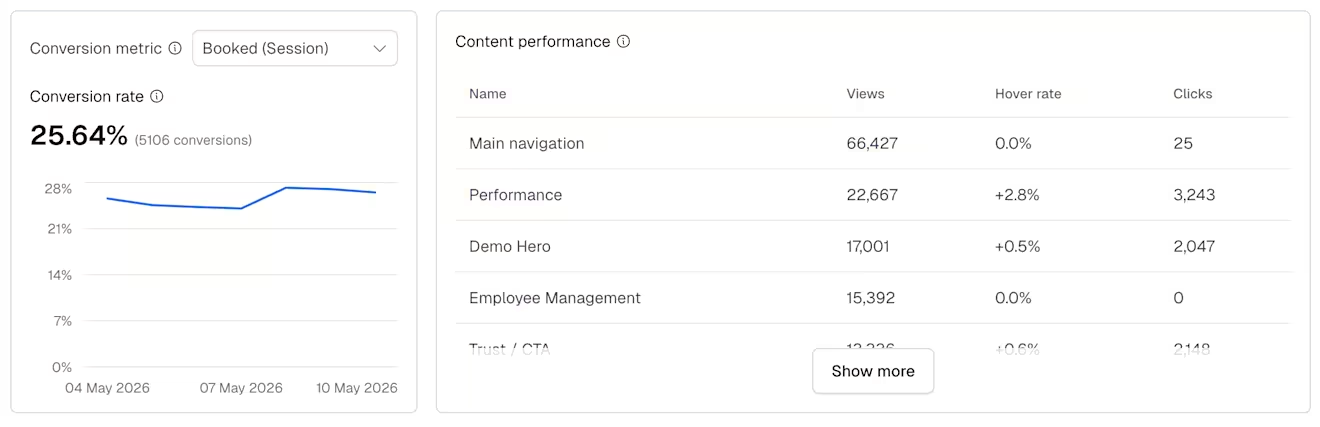
NOTE: Hover rate and click metrics are collected automatically by the SDK, and may not accurately work across all websites. Currently, hover data does not work on mobile and tablet devices.
Total visitors by country – The number of unique visitors that have viewed your content, grouped by country of origin. This helps you understand how your content performs in different locations and decide if you want to optimize the content for those specific countries by introducing localization or conduct research on what resonates more with those visitors.
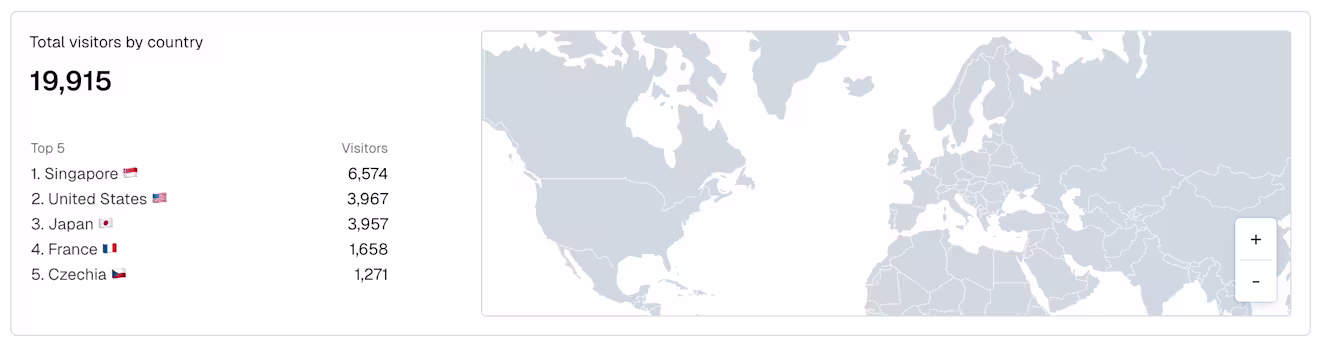
Hover over the map to see a breakdown of the number of visitors by country.
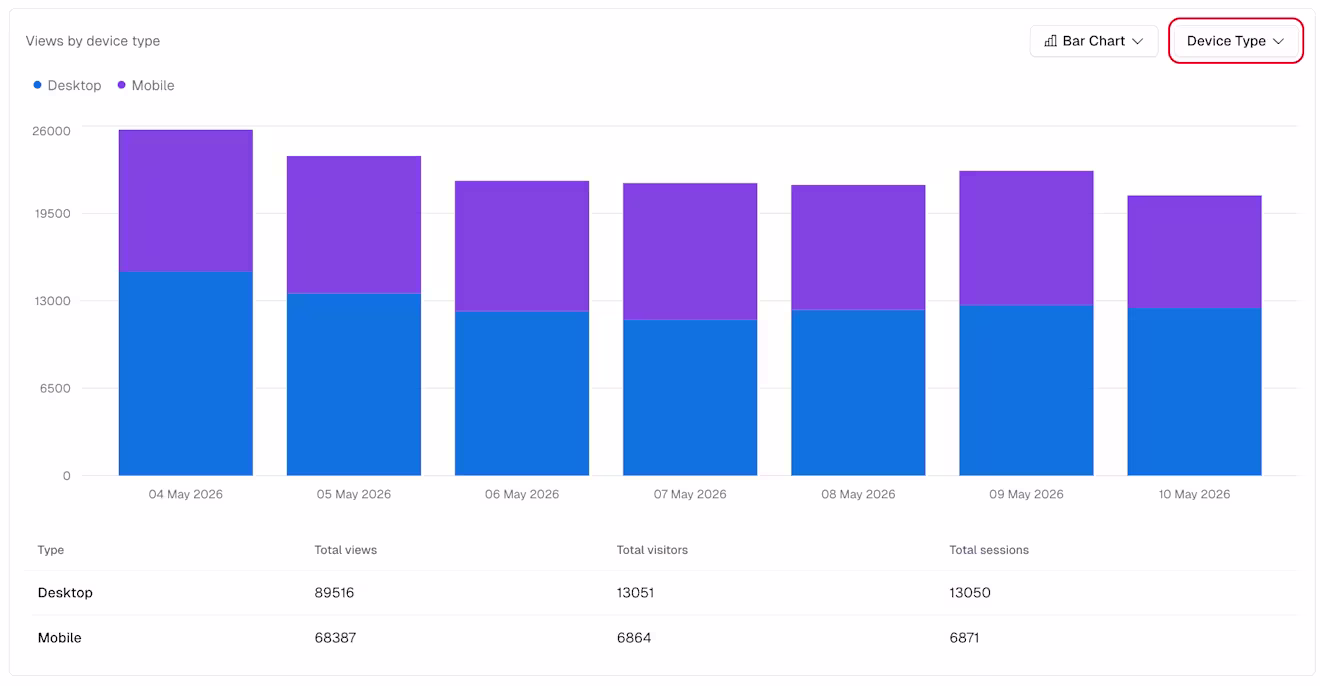
Views by – The number of views broken down by data type: Source, Device Type, URLs, and Audiences. The chart updates based on the data type you select.
Filter your data
To filter your data:
On the Content insights page, click Filter. The "Filters" modal is displayed.
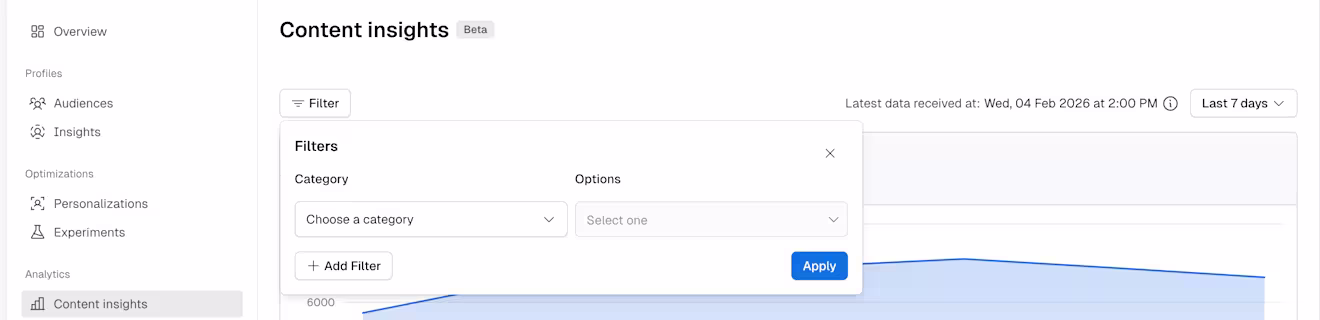
Select the Category you want to apply: Country, Device type, Source, Tags or Audiences.
Set the Options field to the desired value.
NOTE: Based on the Category you select, different Options field values are displayed.
Click Apply. Your filters are applied and the data displayed in the dashboard is updated.
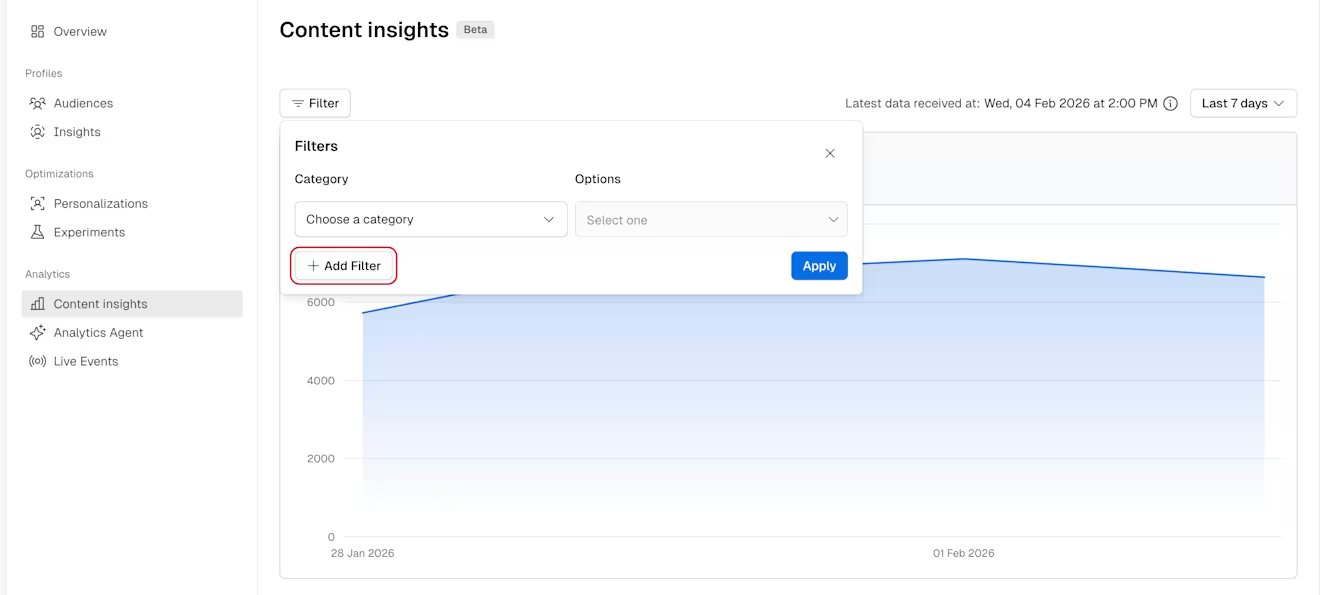
NOTE: You can apply multiple filters on your data by clicking +Add Filter and selecting the desired ones. You can only apply up to 5 filters.
Timeframe
You can select the timeframe to the past 7, 30 or 90 days, giving you insights into how your content has been performing since your latest updates.